Climate Change Chart of Frankfort, USA
Comprehensive Climate Change Chart of Frankfort, USA: Monthly Averages and Impact Trends
Explore the changing climate in Frankfort, USA with insightful data analysis. Discover how temperature, rainfall, snowfall, and sunshine duration have evolved over the years.
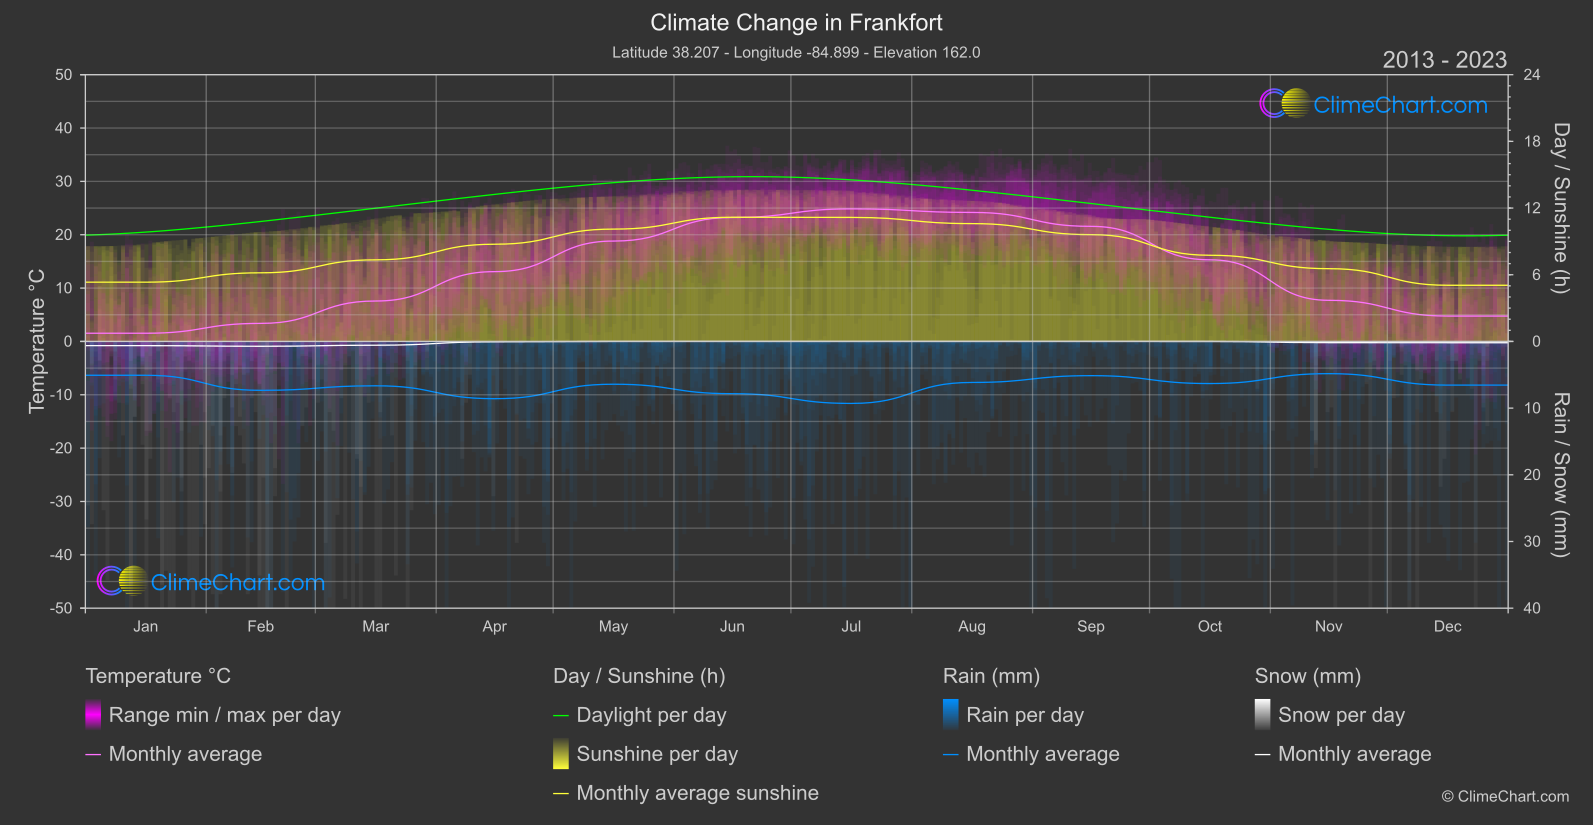
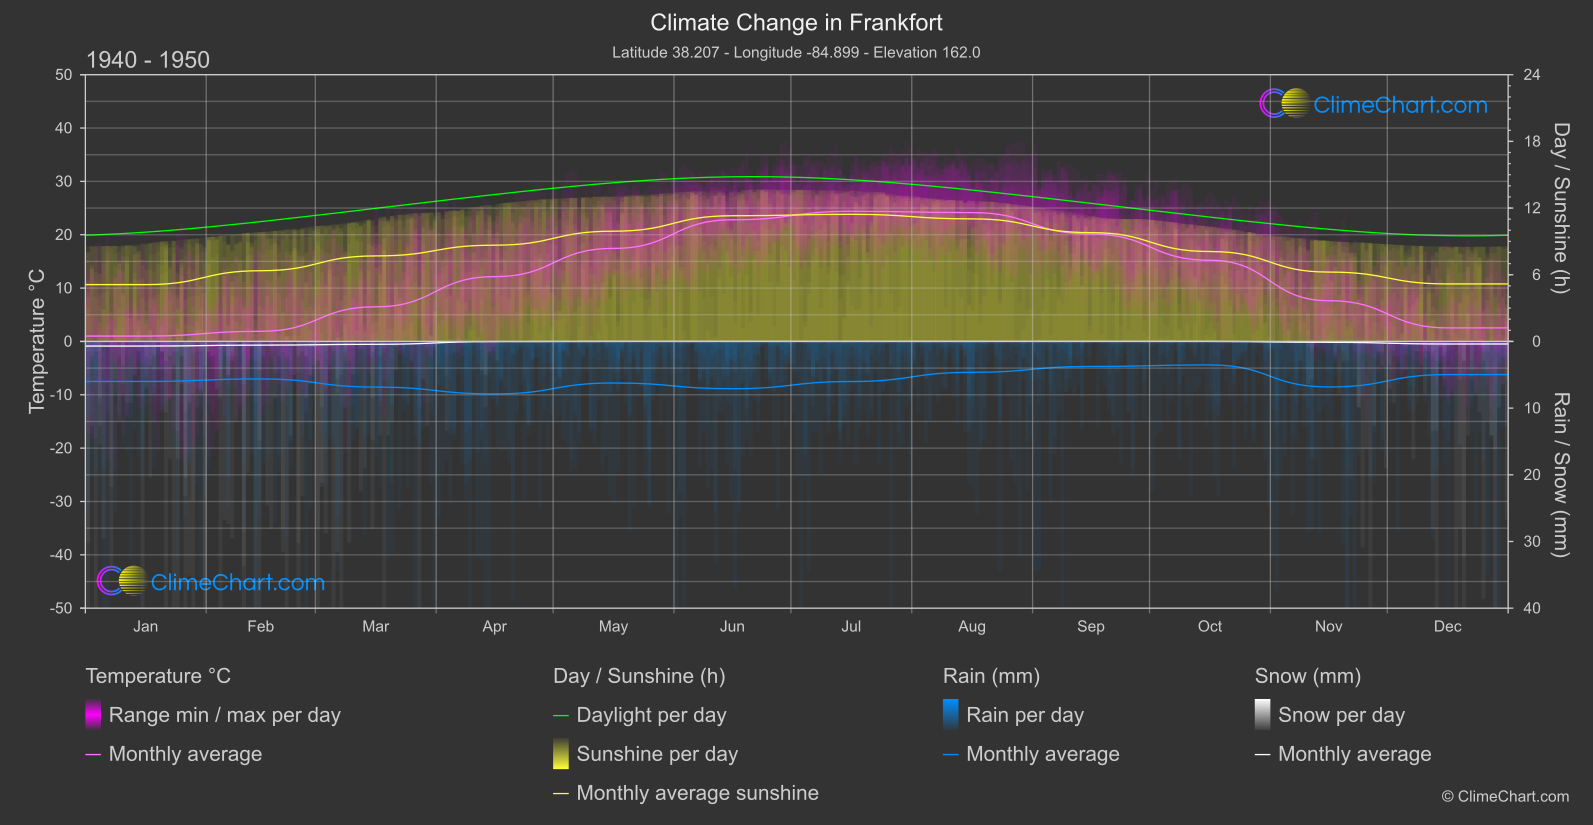
Frankfort, USA, has experienced notable changes in climate over the years. Analyzing the data provided, it is evident that temperatures have generally increased, with December showing the highest temperature change. Rainfall patterns have also shifted, with July experiencing the most significant increase in precipitation. Snowfall has seen variations, with November showing a notable increase. Additionally, the duration of sunshine has fluctuated, notably decreasing in August. These insights highlight the evolving climate trends in Frankfort, USA.
Climate Change Data Overview for Frankfort, USA
Explore the comprehensive climate change data for Frankfort, USA. This detailed table provides valuable insights into temperature variations, precipitation levels, and seasonal changes influenced by climate change, helping you understand the unique weather patterns of this region.
Temperature °C
| Month | ⌀ 1940 - 1950 | ⌀ 2013 - 2023 | +/- |
|---|---|---|---|
| Jan | 1.00 | 1.53 | 0.53 |
| Feb | 1.90 | 3.38 | 1.48 |
| Mar | 6.49 | 7.58 | 1.09 |
| Apr | 12.15 | 13.08 | 0.94 |
| May | 17.44 | 18.81 | 1.37 |
| Jun | 22.80 | 23.23 | 0.43 |
| Jul | 24.39 | 24.85 | 0.46 |
| Aug | 24.15 | 24.18 | 0.03 |
| Sep | 20.13 | 21.57 | 1.44 |
| Oct | 15.22 | 15.30 | 0.08 |
| Nov | 7.63 | 7.71 | 0.07 |
| Dec | 2.54 | 4.76 | 2.22 |
| ⌀ Month | 12.99 | 13.83 | 0.85 |
Sunshine (h)
| Month | ⌀ 1940 - 1950 | ⌀ 2013 - 2023 | +/- |
|---|---|---|---|
| Jan | 5.11 | 5.33 | 0.22 |
| Feb | 6.36 | 6.17 | -0.19 |
| Mar | 7.69 | 7.34 | -0.35 |
| Apr | 8.66 | 8.75 | 0.09 |
| May | 9.92 | 10.11 | 0.19 |
| Jun | 11.31 | 11.17 | -0.14 |
| Jul | 11.44 | 11.16 | -0.28 |
| Aug | 11.03 | 10.60 | -0.42 |
| Sep | 9.79 | 9.61 | -0.18 |
| Oct | 8.09 | 7.75 | -0.34 |
| Nov | 6.24 | 6.55 | 0.30 |
| Dec | 5.17 | 5.05 | -0.12 |
| ⌀ Month | 8.40 | 8.30 | -0.10 |
Rain (mm)
| Month | ⌀ 1940 - 1950 | ⌀ 2013 - 2023 | +/- |
|---|---|---|---|
| Jan | 3.00 | 2.54 | -0.46 |
| Feb | 2.81 | 3.67 | 0.85 |
| Mar | 3.42 | 3.33 | -0.10 |
| Apr | 3.93 | 4.29 | 0.36 |
| May | 3.12 | 3.21 | 0.09 |
| Jun | 3.54 | 3.92 | 0.37 |
| Jul | 3.01 | 4.65 | 1.64 |
| Aug | 2.32 | 3.08 | 0.76 |
| Sep | 1.87 | 2.57 | 0.69 |
| Oct | 1.76 | 3.16 | 1.40 |
| Nov | 3.41 | 2.42 | -1.00 |
| Dec | 2.49 | 3.28 | 0.79 |
| ⌀ Month | 2.89 | 3.34 | 0.45 |
Snow (mm)
| Month | ⌀ 1940 - 1950 | ⌀ 2013 - 2023 | +/- |
|---|---|---|---|
| Jan | 0.35 | 0.32 | -0.03 |
| Feb | 0.28 | 0.36 | 0.09 |
| Mar | 0.22 | 0.28 | 0.07 |
| Apr | 0.01 | 0.03 | 0.02 |
| May | 0.00 | 0.00 | 0.00 |
| Jun | 0.00 | 0.00 | 0.00 |
| Jul | 0.00 | 0.00 | 0.00 |
| Aug | 0.00 | 0.00 | 0.00 |
| Sep | 0.00 | 0.00 | 0.00 |
| Oct | 0.00 | 0.00 | 0.00 |
| Nov | 0.07 | 0.09 | 0.02 |
| Dec | 0.19 | 0.10 | -0.10 |
| ⌀ Month | 0.09 | 0.10 | 0.01 |