Climate Change Chart of Foshan, China
Comprehensive Climate Change Chart of Foshan, China: Monthly Averages and Impact Trends
Explore the changing climate in Foshan, China, through insightful data analysis.
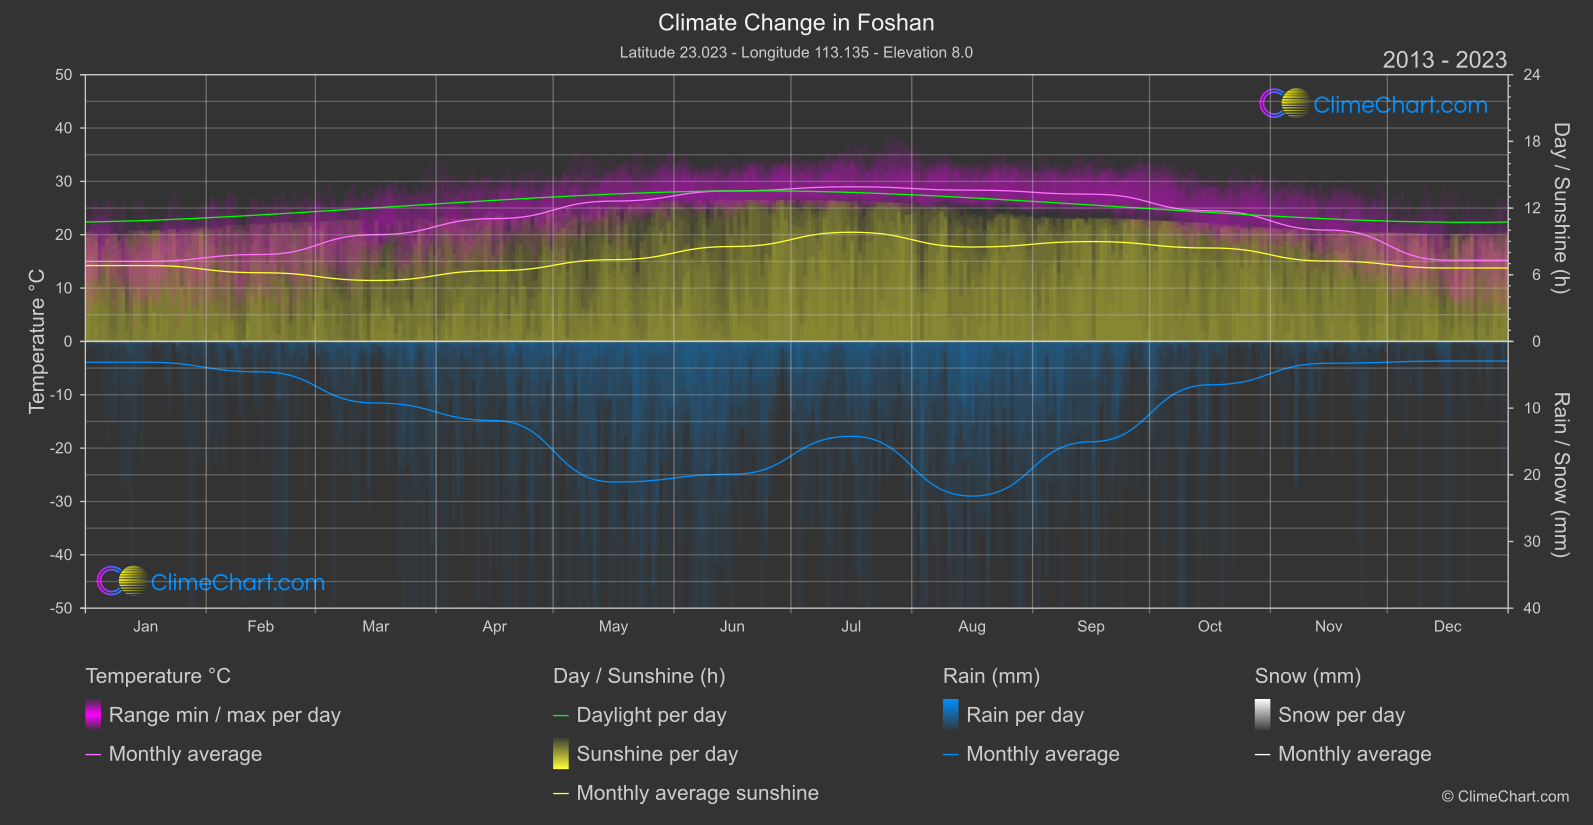
Foshan, a city in southern China, has experienced notable changes in temperature, rainfall, and sunshine duration over the years. From January to December, the data shows fluctuations in these climatic factors, with certain months exhibiting significant changes. For instance, the month of November has shown a substantial increase in temperature, while March has experienced a remarkable rise in rainfall. Dive deeper into the climate trends of Foshan, China, to understand the impact of climate change on this region.
Climate Change Data Overview for Foshan, China
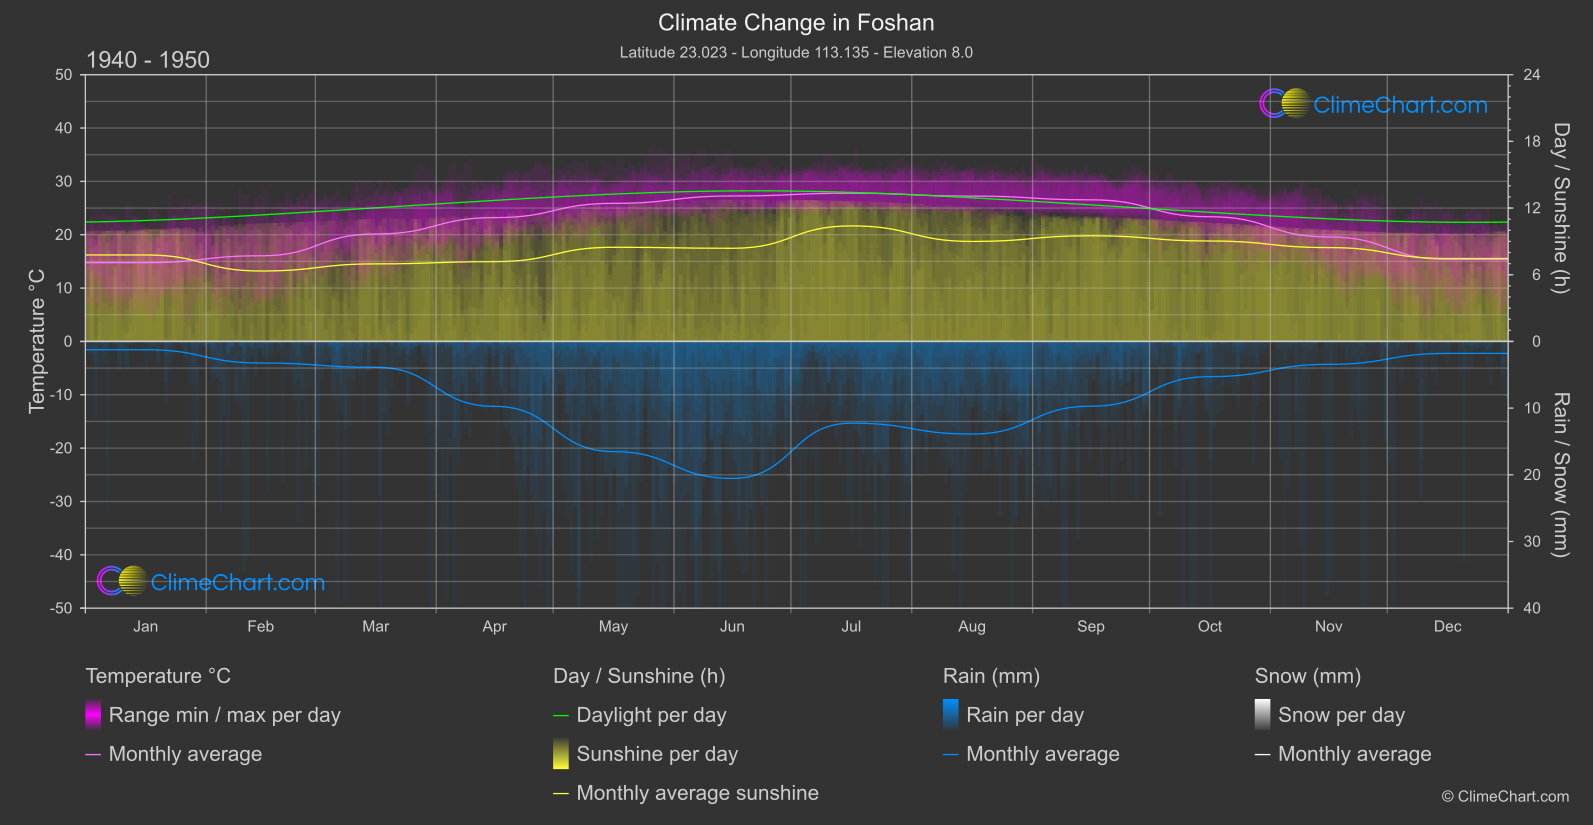
Explore the comprehensive climate change data for Foshan, China. This detailed table provides valuable insights into temperature variations, precipitation levels, and seasonal changes influenced by climate change, helping you understand the unique weather patterns of this region.
Temperature °C
| Month | ⌀ 1940 - 1950 | ⌀ 2013 - 2023 | +/- |
|---|---|---|---|
| Jan | 14.77 | 15.01 | 0.24 |
| Feb | 16.05 | 16.29 | 0.24 |
| Mar | 20.14 | 20.01 | -0.13 |
| Apr | 23.21 | 23.02 | -0.19 |
| May | 25.88 | 26.31 | 0.43 |
| Jun | 27.26 | 28.22 | 0.96 |
| Jul | 27.79 | 28.99 | 1.20 |
| Aug | 27.24 | 28.36 | 1.11 |
| Sep | 26.54 | 27.60 | 1.06 |
| Oct | 23.37 | 24.49 | 1.11 |
| Nov | 19.58 | 20.87 | 1.29 |
| Dec | 15.36 | 15.23 | -0.13 |
| ⌀ Month | 22.27 | 22.87 | 0.60 |
Sunshine (h)
| Month | ⌀ 1940 - 1950 | ⌀ 2013 - 2023 | +/- |
|---|---|---|---|
| Jan | 7.78 | 6.83 | -0.95 |
| Feb | 6.34 | 6.18 | -0.16 |
| Mar | 6.98 | 5.49 | -1.49 |
| Apr | 7.18 | 6.37 | -0.81 |
| May | 8.47 | 7.35 | -1.12 |
| Jun | 8.38 | 8.54 | 0.16 |
| Jul | 10.39 | 9.82 | -0.57 |
| Aug | 9.00 | 8.49 | -0.50 |
| Sep | 9.51 | 8.99 | -0.52 |
| Oct | 9.03 | 8.41 | -0.63 |
| Nov | 8.44 | 7.23 | -1.22 |
| Dec | 7.46 | 6.60 | -0.86 |
| ⌀ Month | 8.25 | 7.52 | -0.72 |
Rain (mm)
| Month | ⌀ 1940 - 1950 | ⌀ 2013 - 2023 | +/- |
|---|---|---|---|
| Jan | 0.62 | 1.56 | 0.94 |
| Feb | 1.62 | 2.28 | 0.67 |
| Mar | 1.94 | 4.62 | 2.68 |
| Apr | 4.87 | 5.93 | 1.06 |
| May | 8.26 | 10.54 | 2.28 |
| Jun | 10.27 | 9.96 | -0.31 |
| Jul | 6.13 | 7.11 | 0.98 |
| Aug | 6.94 | 11.60 | 4.65 |
| Sep | 4.86 | 7.52 | 2.67 |
| Oct | 2.64 | 3.25 | 0.61 |
| Nov | 1.72 | 1.63 | -0.09 |
| Dec | 0.90 | 1.47 | 0.58 |
| ⌀ Month | 4.23 | 5.62 | 1.39 |
Snow (mm)
| Month | ⌀ 1940 - 1950 | ⌀ 2013 - 2023 | +/- |
|---|---|---|---|
| Jan | 0.00 | 0.00 | 0.00 |
| Feb | 0.00 | 0.00 | 0.00 |
| Mar | 0.00 | 0.00 | 0.00 |
| Apr | 0.00 | 0.00 | 0.00 |
| May | 0.00 | 0.00 | 0.00 |
| Jun | 0.00 | 0.00 | 0.00 |
| Jul | 0.00 | 0.00 | 0.00 |
| Aug | 0.00 | 0.00 | 0.00 |
| Sep | 0.00 | 0.00 | 0.00 |
| Oct | 0.00 | 0.00 | 0.00 |
| Nov | 0.00 | 0.00 | 0.00 |
| Dec | 0.00 | 0.00 | 0.00 |
| ⌀ Month | 0.00 | 0.00 | 0.00 |