Climate Change Chart of Edinburgh, Great Britain
Comprehensive Climate Change Chart of Edinburgh, Great Britain: Monthly Averages and Impact Trends
Exploring the climate change data in Edinburgh, UK reveals fascinating insights into the shifting weather patterns over the years.
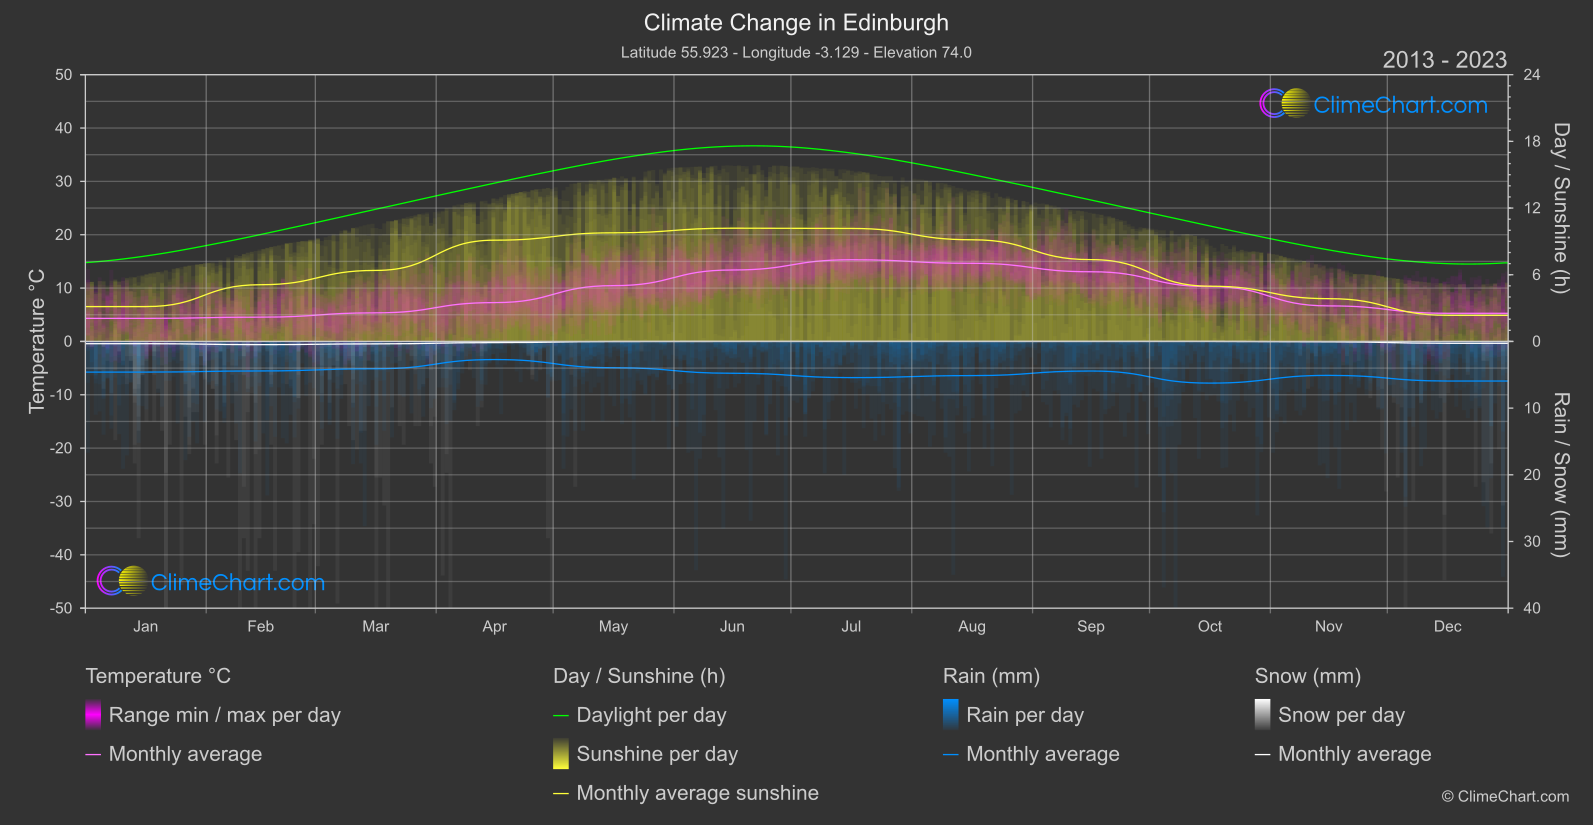
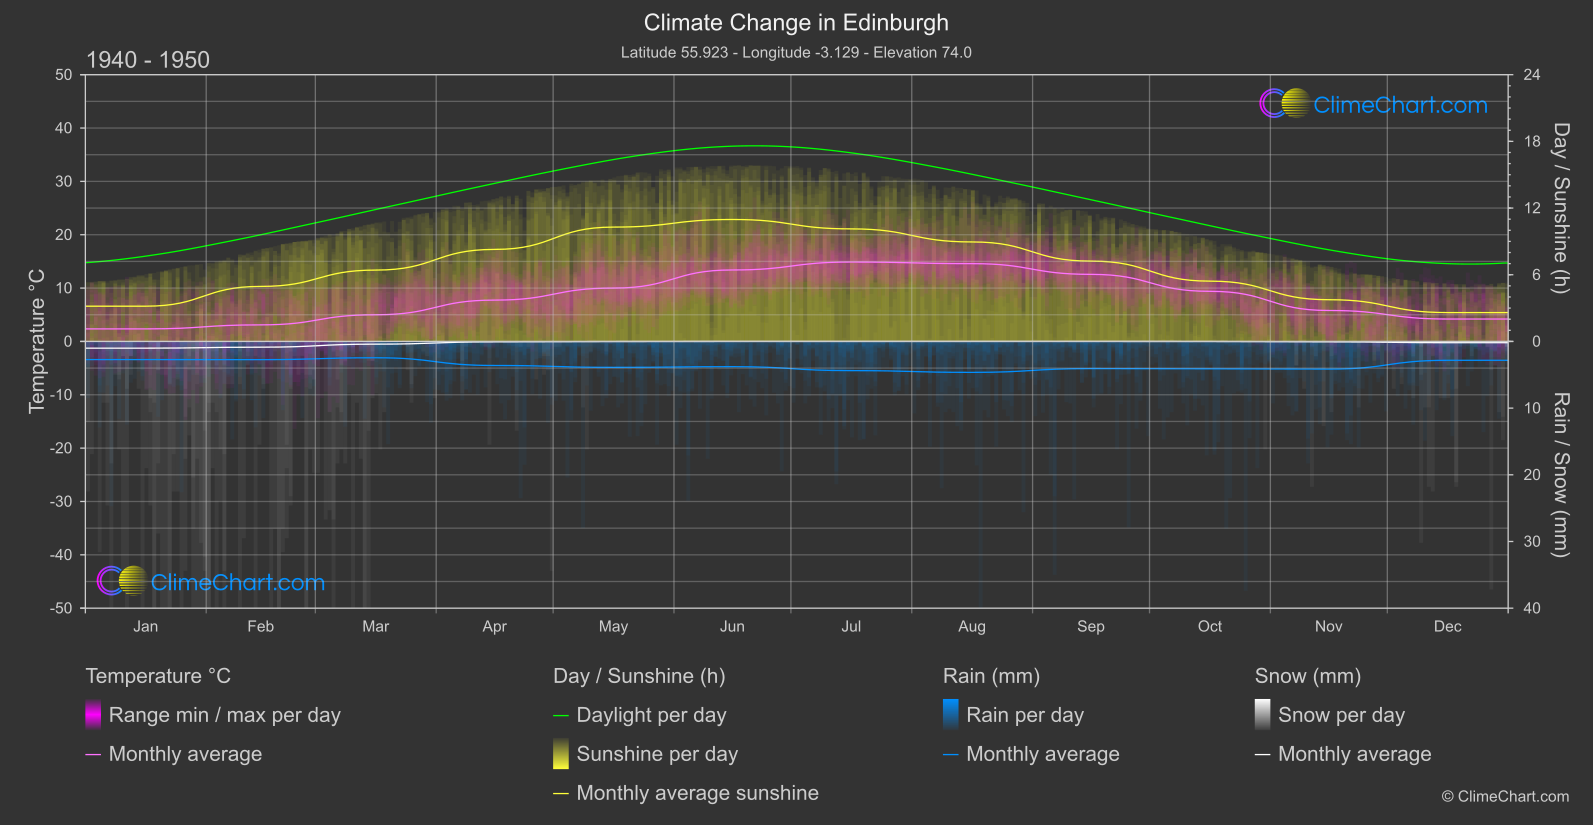
Edinburgh, the capital of Scotland, experiences notable shifts in temperature, rainfall, snowfall, and sunshine duration. Analyzing the data from 1940 - 1950 compared to 2013 - 2024, it is evident that certain months have shown significant changes. For example, January witnessed a temperature increase of 1.97°C and a rainfall increase of 0.94mm. Conversely, April saw a decrease in temperature by 0.47°C and a decrease in snowfall by 0.44mm. Notably, the month with the highest temperature change was December, with a 1.08°C increase.
Climate Change Data Overview for Edinburgh, Great Britain
Explore the comprehensive climate change data for Edinburgh, Great Britain. This detailed table provides valuable insights into temperature variations, precipitation levels, and seasonal changes influenced by climate change, helping you understand the unique weather patterns of this region.
Temperature °C
| Month | ⌀ 1940 - 1950 | ⌀ 2013 - 2023 | +/- |
|---|---|---|---|
| Jan | 2.35 | 4.32 | 1.97 |
| Feb | 3.10 | 4.55 | 1.45 |
| Mar | 5.00 | 5.36 | 0.36 |
| Apr | 7.75 | 7.28 | -0.47 |
| May | 10.00 | 10.46 | 0.46 |
| Jun | 13.40 | 13.39 | -0.00 |
| Jul | 14.88 | 15.31 | 0.42 |
| Aug | 14.58 | 14.64 | 0.06 |
| Sep | 12.57 | 13.06 | 0.49 |
| Oct | 9.39 | 10.28 | 0.89 |
| Nov | 5.80 | 6.66 | 0.86 |
| Dec | 4.20 | 5.27 | 1.08 |
| ⌀ Month | 8.59 | 9.22 | 0.63 |
Sunshine (h)
| Month | ⌀ 1940 - 1950 | ⌀ 2013 - 2023 | +/- |
|---|---|---|---|
| Jan | 3.17 | 3.13 | -0.04 |
| Feb | 4.95 | 5.10 | 0.15 |
| Mar | 6.42 | 6.39 | -0.03 |
| Apr | 8.28 | 9.11 | 0.83 |
| May | 10.29 | 9.77 | -0.52 |
| Jun | 10.97 | 10.19 | -0.78 |
| Jul | 10.13 | 10.17 | 0.04 |
| Aug | 8.95 | 9.15 | 0.20 |
| Sep | 7.23 | 7.36 | 0.13 |
| Oct | 5.43 | 4.97 | -0.45 |
| Nov | 3.75 | 3.85 | 0.09 |
| Dec | 2.60 | 2.35 | -0.25 |
| ⌀ Month | 6.85 | 6.79 | -0.05 |
Rain (mm)
| Month | ⌀ 1940 - 1950 | ⌀ 2013 - 2023 | +/- |
|---|---|---|---|
| Jan | 1.36 | 2.30 | 0.94 |
| Feb | 1.37 | 2.21 | 0.85 |
| Mar | 1.22 | 2.05 | 0.82 |
| Apr | 1.80 | 1.36 | -0.44 |
| May | 1.94 | 1.97 | 0.03 |
| Jun | 1.89 | 2.39 | 0.50 |
| Jul | 2.19 | 2.71 | 0.52 |
| Aug | 2.32 | 2.56 | 0.24 |
| Sep | 2.04 | 2.22 | 0.18 |
| Oct | 2.05 | 3.12 | 1.07 |
| Nov | 2.07 | 2.55 | 0.47 |
| Dec | 1.41 | 2.97 | 1.55 |
| ⌀ Month | 1.81 | 2.37 | 0.56 |
Snow (mm)
| Month | ⌀ 1940 - 1950 | ⌀ 2013 - 2023 | +/- |
|---|---|---|---|
| Jan | 0.50 | 0.17 | -0.34 |
| Feb | 0.43 | 0.24 | -0.19 |
| Mar | 0.20 | 0.18 | -0.02 |
| Apr | 0.03 | 0.09 | 0.06 |
| May | 0.01 | 0.01 | -0.00 |
| Jun | 0.00 | 0.00 | 0.00 |
| Jul | 0.00 | 0.00 | 0.00 |
| Aug | 0.00 | 0.00 | 0.00 |
| Sep | 0.00 | 0.00 | 0.00 |
| Oct | 0.00 | 0.00 | -0.00 |
| Nov | 0.03 | 0.03 | -0.00 |
| Dec | 0.10 | 0.14 | 0.04 |
| ⌀ Month | 0.11 | 0.07 | -0.04 |