Climate Change Chart of Easter Island, Chile
Comprehensive Climate Change Chart of Easter Island, Chile: Monthly Averages and Impact Trends
Exploring the changing climate patterns in Easter Island, Chile reveals intriguing insights into temperature, rainfall, and sunshine duration over the years.
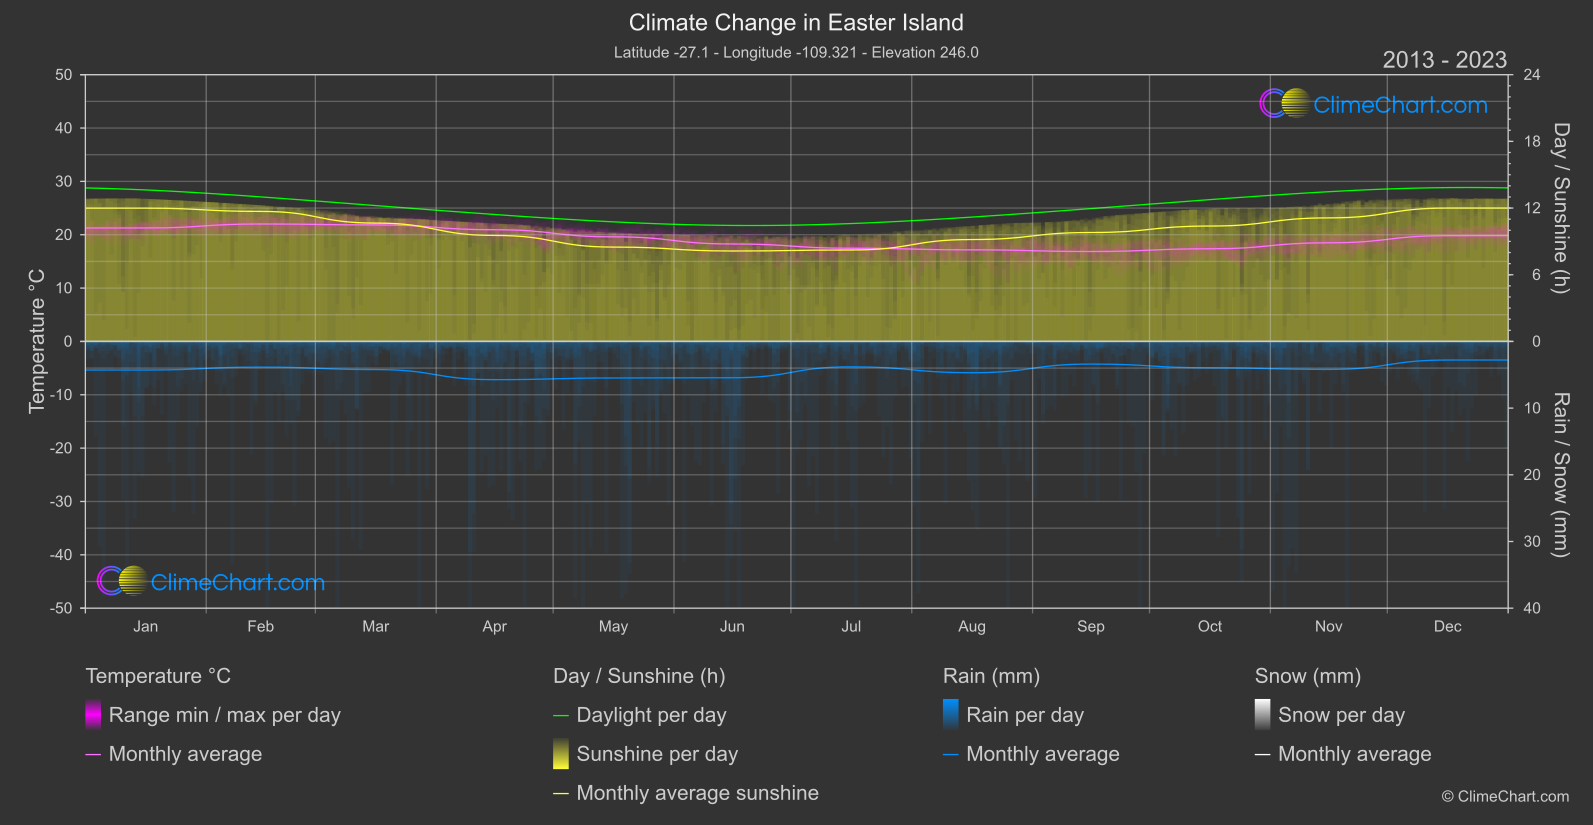
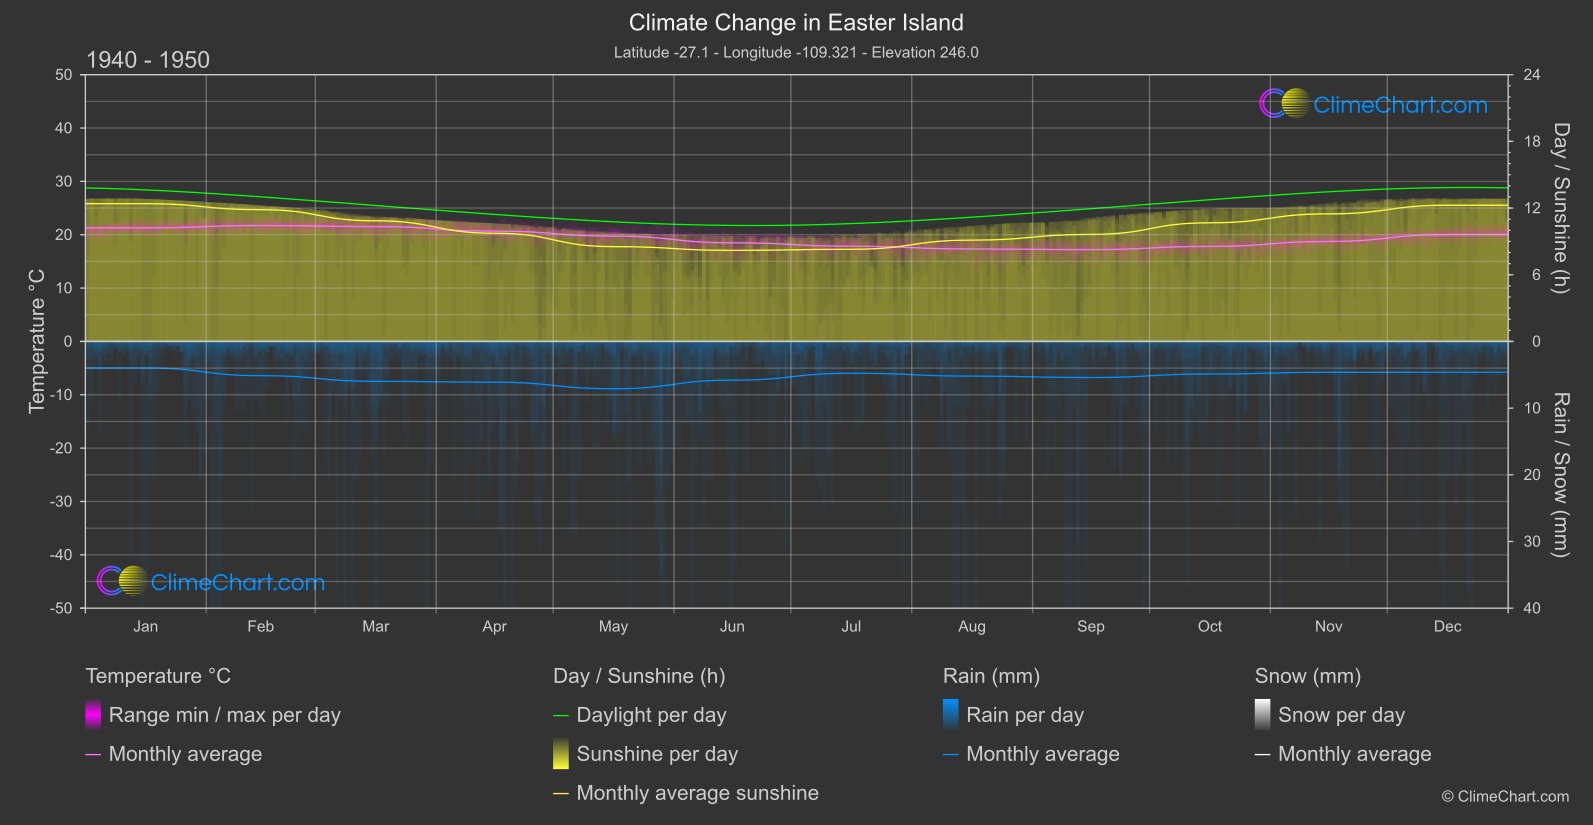
Easter Island in Chile has experienced changes in climate with notable variations in temperature, rainfall, and sunshine duration. The data from 1940 to 1950 compared to 2013 to 2024 shows interesting trends. For instance, February had a significant temperature increase of 0.28°C, while September saw a considerable decrease in temperature by 0.36°C. In terms of rainfall, April had a slight decrease of 0.19 mm, whereas September experienced a significant decrease of 1.01 mm. Sunshine duration also showed fluctuations, with months like August seeing a slight increase in sunshine hours, while months like November had a notable decrease in sunshine duration.
Climate Change Data Overview for Easter Island, Chile
Explore the comprehensive climate change data for Easter Island, Chile. This detailed table provides valuable insights into temperature variations, precipitation levels, and seasonal changes influenced by climate change, helping you understand the unique weather patterns of this region.
Temperature °C
| Month | ⌀ 1940 - 1950 | ⌀ 2013 - 2023 | +/- |
|---|---|---|---|
| Jan | 21.29 | 21.27 | -0.02 |
| Feb | 21.73 | 22.01 | 0.28 |
| Mar | 21.52 | 21.84 | 0.32 |
| Apr | 20.68 | 20.94 | 0.25 |
| May | 19.74 | 19.61 | -0.13 |
| Jun | 18.48 | 18.27 | -0.22 |
| Jul | 17.84 | 17.47 | -0.37 |
| Aug | 17.33 | 17.17 | -0.16 |
| Sep | 17.21 | 16.86 | -0.36 |
| Oct | 17.81 | 17.37 | -0.44 |
| Nov | 18.75 | 18.49 | -0.26 |
| Dec | 20.04 | 19.83 | -0.21 |
| ⌀ Month | 19.37 | 19.26 | -0.11 |
Sunshine (h)
| Month | ⌀ 1940 - 1950 | ⌀ 2013 - 2023 | +/- |
|---|---|---|---|
| Jan | 12.40 | 11.99 | -0.41 |
| Feb | 11.85 | 11.70 | -0.16 |
| Mar | 10.85 | 10.65 | -0.20 |
| Apr | 9.73 | 9.54 | -0.20 |
| May | 8.53 | 8.49 | -0.04 |
| Jun | 8.19 | 8.14 | -0.06 |
| Jul | 8.29 | 8.23 | -0.07 |
| Aug | 9.12 | 9.17 | 0.05 |
| Sep | 9.63 | 9.80 | 0.17 |
| Oct | 10.67 | 10.38 | -0.29 |
| Nov | 11.48 | 11.12 | -0.36 |
| Dec | 12.26 | 12.00 | -0.26 |
| ⌀ Month | 10.25 | 10.10 | -0.15 |
Rain (mm)
| Month | ⌀ 1940 - 1950 | ⌀ 2013 - 2023 | +/- |
|---|---|---|---|
| Jan | 1.99 | 2.14 | 0.15 |
| Feb | 2.57 | 1.92 | -0.64 |
| Mar | 2.99 | 2.11 | -0.88 |
| Apr | 3.06 | 2.87 | -0.19 |
| May | 3.55 | 2.74 | -0.81 |
| Jun | 2.90 | 2.72 | -0.18 |
| Jul | 2.38 | 1.90 | -0.48 |
| Aug | 2.60 | 2.35 | -0.25 |
| Sep | 2.71 | 1.70 | -1.01 |
| Oct | 2.44 | 1.98 | -0.46 |
| Nov | 2.31 | 2.10 | -0.21 |
| Dec | 2.31 | 1.40 | -0.91 |
| ⌀ Month | 2.65 | 2.16 | -0.49 |
Snow (mm)
| Month | ⌀ 1940 - 1950 | ⌀ 2013 - 2023 | +/- |
|---|---|---|---|
| Jan | 0.00 | 0.00 | 0.00 |
| Feb | 0.00 | 0.00 | 0.00 |
| Mar | 0.00 | 0.00 | 0.00 |
| Apr | 0.00 | 0.00 | 0.00 |
| May | 0.00 | 0.00 | 0.00 |
| Jun | 0.00 | 0.00 | 0.00 |
| Jul | 0.00 | 0.00 | 0.00 |
| Aug | 0.00 | 0.00 | 0.00 |
| Sep | 0.00 | 0.00 | 0.00 |
| Oct | 0.00 | 0.00 | 0.00 |
| Nov | 0.00 | 0.00 | 0.00 |
| Dec | 0.00 | 0.00 | 0.00 |
| ⌀ Month | 0.00 | 0.00 | 0.00 |