Climate Change Chart of Dresden, Germany
Comprehensive Climate Change Chart of Dresden, Germany: Monthly Averages and Impact Trends
Discover how climate change has impacted Dresden, Germany, by exploring the temperature, rainfall, snowfall, and sunshine duration data from 1940 - 1950 compared to 2013 - 2024.
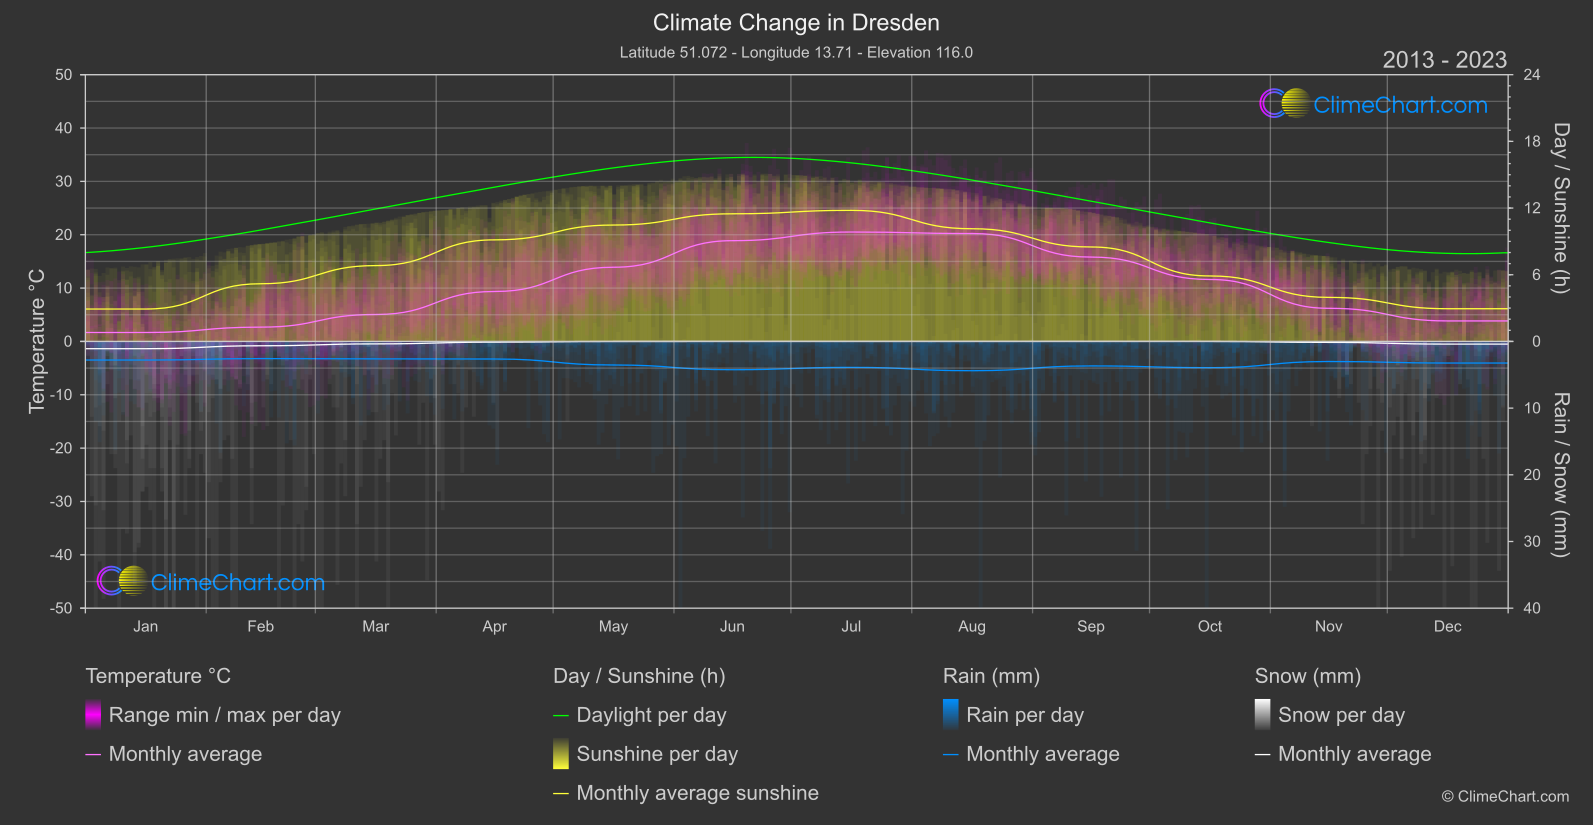
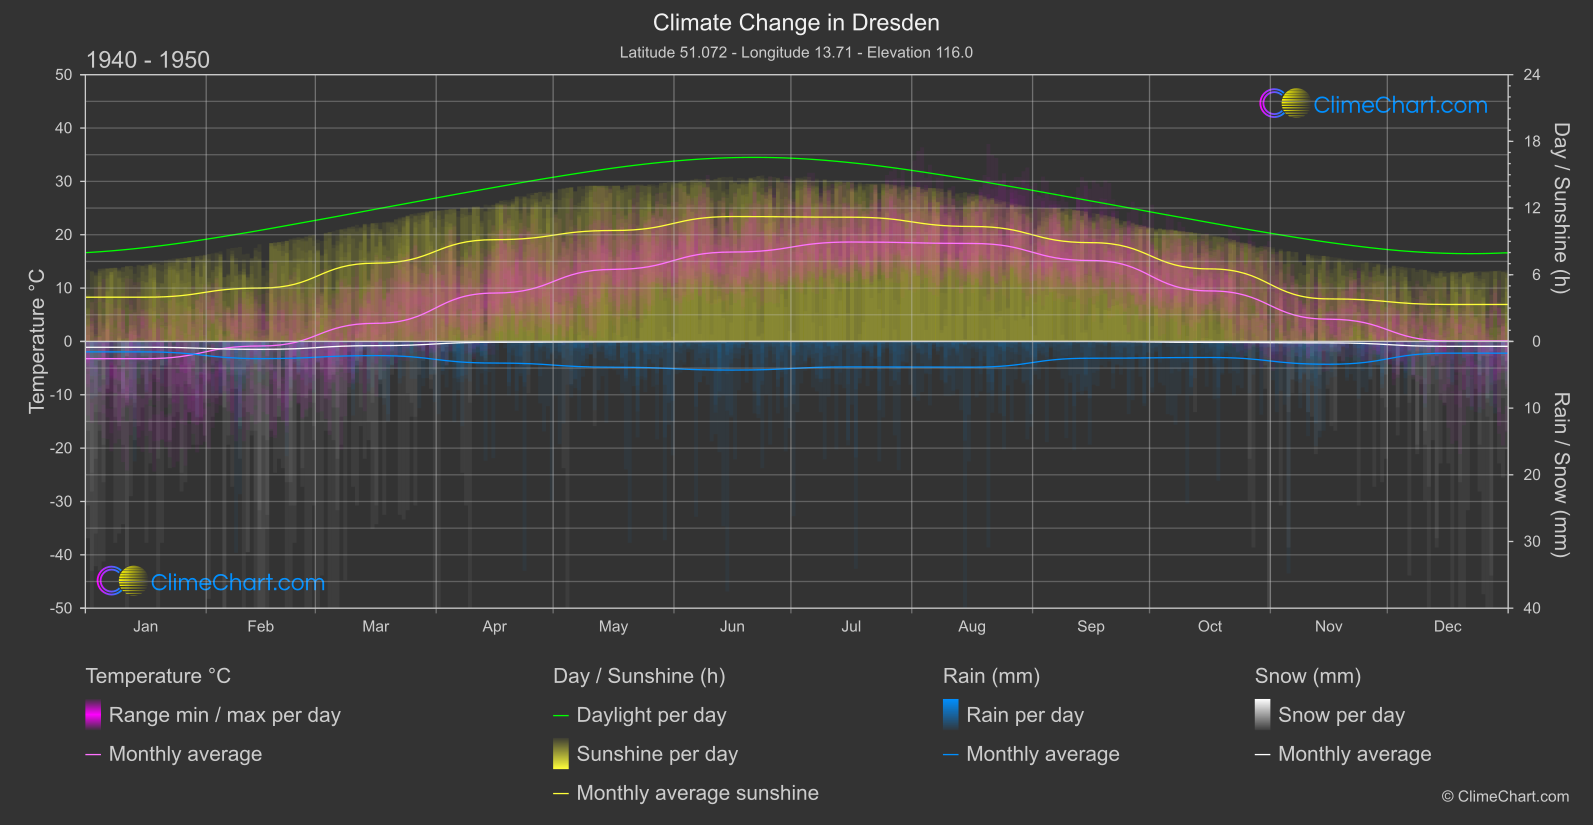
Dresden, Germany, has experienced significant changes in its climate over the years. The data shows that the month with the highest temperature change is July, with an increase of 1.87°C from 1940 - 1950 to 2013 - 2024. In terms of rainfall, October experienced the largest increase of 0.76 mm of rainfall during the same periods. Snowfall has generally decreased over the years, with notable reductions in November and December. Additionally, sunshine duration has shown variations, with July having the highest increase in hours of sunshine.
Climate Change Data Overview for Dresden, Germany
Explore the comprehensive climate change data for Dresden, Germany. This detailed table provides valuable insights into temperature variations, precipitation levels, and seasonal changes influenced by climate change, helping you understand the unique weather patterns of this region.
Temperature °C
| Month | ⌀ 1940 - 1950 | ⌀ 2013 - 2023 | +/- |
|---|---|---|---|
| Jan | -3.23 | 1.67 | 4.90 |
| Feb | -0.85 | 2.68 | 3.53 |
| Mar | 3.40 | 5.05 | 1.65 |
| Apr | 9.07 | 9.36 | 0.29 |
| May | 13.50 | 13.91 | 0.40 |
| Jun | 16.76 | 18.89 | 2.13 |
| Jul | 18.64 | 20.51 | 1.87 |
| Aug | 18.36 | 20.23 | 1.86 |
| Sep | 15.16 | 15.81 | 0.65 |
| Oct | 9.47 | 11.61 | 2.14 |
| Nov | 4.16 | 6.21 | 2.05 |
| Dec | 0.10 | 3.84 | 3.74 |
| ⌀ Month | 8.71 | 10.81 | 2.10 |
Sunshine (h)
| Month | ⌀ 1940 - 1950 | ⌀ 2013 - 2023 | +/- |
|---|---|---|---|
| Jan | 3.98 | 2.91 | -1.07 |
| Feb | 4.80 | 5.19 | 0.39 |
| Mar | 7.04 | 6.82 | -0.22 |
| Apr | 9.16 | 9.14 | -0.02 |
| May | 9.98 | 10.47 | 0.49 |
| Jun | 11.24 | 11.48 | 0.25 |
| Jul | 11.18 | 11.79 | 0.62 |
| Aug | 10.34 | 10.14 | -0.20 |
| Sep | 8.89 | 8.50 | -0.39 |
| Oct | 6.53 | 5.89 | -0.63 |
| Nov | 3.83 | 3.96 | 0.13 |
| Dec | 3.33 | 2.94 | -0.38 |
| ⌀ Month | 7.52 | 7.44 | -0.09 |
Rain (mm)
| Month | ⌀ 1940 - 1950 | ⌀ 2013 - 2023 | +/- |
|---|---|---|---|
| Jan | 0.79 | 1.40 | 0.61 |
| Feb | 1.29 | 1.29 | -0.00 |
| Mar | 1.06 | 1.31 | 0.24 |
| Apr | 1.62 | 1.32 | -0.30 |
| May | 1.93 | 1.77 | -0.17 |
| Jun | 2.15 | 2.12 | -0.03 |
| Jul | 1.91 | 1.94 | 0.03 |
| Aug | 1.93 | 2.20 | 0.27 |
| Sep | 1.26 | 1.84 | 0.58 |
| Oct | 1.21 | 1.97 | 0.76 |
| Nov | 1.71 | 1.51 | -0.20 |
| Dec | 0.88 | 1.62 | 0.74 |
| ⌀ Month | 1.48 | 1.69 | 0.21 |
Snow (mm)
| Month | ⌀ 1940 - 1950 | ⌀ 2013 - 2023 | +/- |
|---|---|---|---|
| Jan | 0.44 | 0.54 | 0.11 |
| Feb | 0.59 | 0.32 | -0.27 |
| Mar | 0.32 | 0.18 | -0.13 |
| Apr | 0.06 | 0.05 | -0.01 |
| May | 0.03 | 0.00 | -0.02 |
| Jun | 0.00 | 0.00 | 0.00 |
| Jul | 0.00 | 0.00 | 0.00 |
| Aug | 0.00 | 0.00 | 0.00 |
| Sep | 0.00 | 0.00 | 0.00 |
| Oct | 0.07 | 0.00 | -0.07 |
| Nov | 0.11 | 0.07 | -0.04 |
| Dec | 0.37 | 0.20 | -0.17 |
| ⌀ Month | 0.17 | 0.12 | -0.05 |