Climate Change Chart of Dover, USA
Comprehensive Climate Change Chart of Dover, USA: Monthly Averages and Impact Trends
Explore the changing climate patterns in Dover, USA, with insights on temperature, rainfall, snowfall, and sunshine duration over the years.
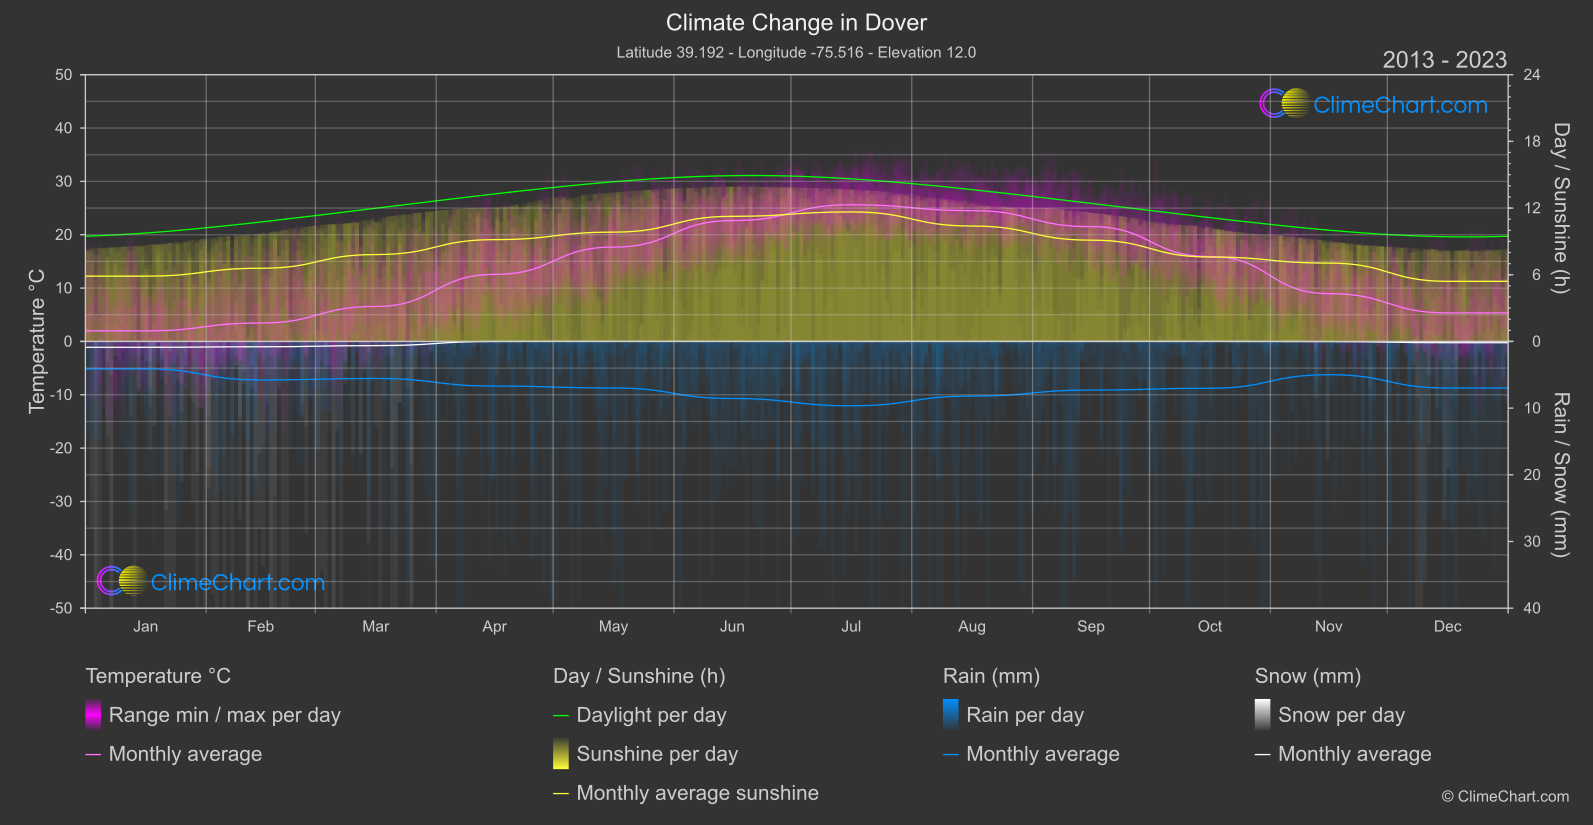
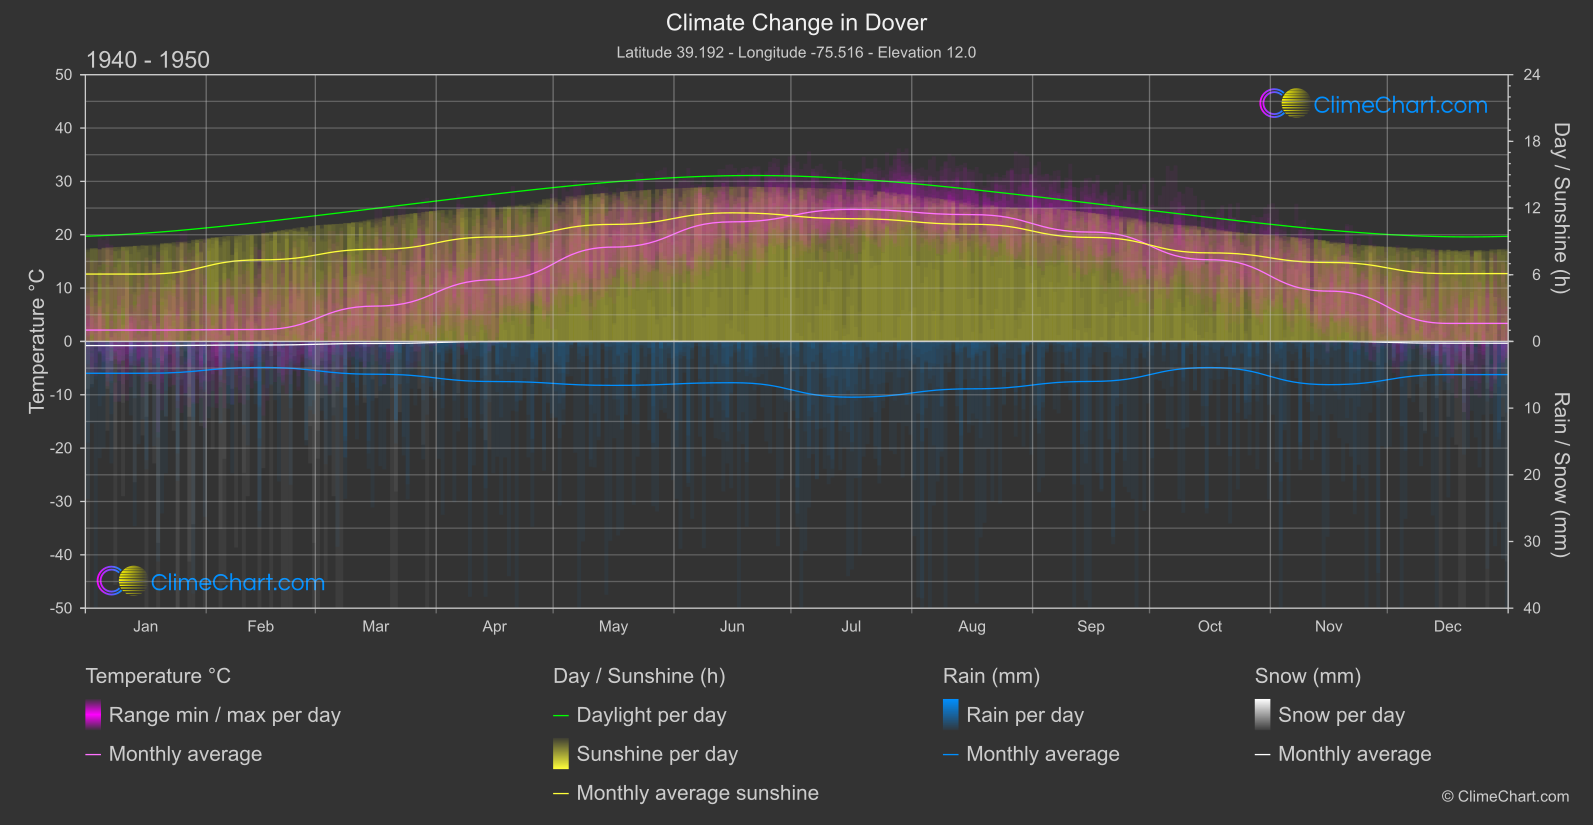
Dover, USA, has experienced notable shifts in climate indicators over the years. The data reveals interesting trends, such as temperature increases in some months and fluctuations in rainfall and sunshine duration. For example, the month with the highest temperature change was in December, with a significant rise of 1.96°C compared to the earlier period. Additionally, October showed the largest increase in rainfall by 1.55mm. Snowfall had minimal changes but varied by month. Insights into these climate changes can help us understand the evolving climate patterns in Dover.
Climate Change Data Overview for Dover, USA
Explore the comprehensive climate change data for Dover, USA. This detailed table provides valuable insights into temperature variations, precipitation levels, and seasonal changes influenced by climate change, helping you understand the unique weather patterns of this region.
Temperature °C
| Month | ⌀ 1940 - 1950 | ⌀ 2013 - 2023 | +/- |
|---|---|---|---|
| Jan | 2.13 | 1.98 | -0.15 |
| Feb | 2.23 | 3.45 | 1.22 |
| Mar | 6.62 | 6.56 | -0.06 |
| Apr | 11.56 | 12.56 | 1.00 |
| May | 17.69 | 17.69 | 0.00 |
| Jun | 22.42 | 22.65 | 0.23 |
| Jul | 24.75 | 25.62 | 0.87 |
| Aug | 23.77 | 24.51 | 0.75 |
| Sep | 20.50 | 21.52 | 1.02 |
| Oct | 15.31 | 15.91 | 0.61 |
| Nov | 9.43 | 8.96 | -0.47 |
| Dec | 3.38 | 5.35 | 1.96 |
| ⌀ Month | 13.32 | 13.90 | 0.58 |
Sunshine (h)
| Month | ⌀ 1940 - 1950 | ⌀ 2013 - 2023 | +/- |
|---|---|---|---|
| Jan | 6.06 | 5.88 | -0.19 |
| Feb | 7.34 | 6.58 | -0.75 |
| Mar | 8.29 | 7.82 | -0.48 |
| Apr | 9.40 | 9.16 | -0.24 |
| May | 10.53 | 9.83 | -0.70 |
| Jun | 11.57 | 11.26 | -0.31 |
| Jul | 11.04 | 11.65 | 0.61 |
| Aug | 10.54 | 10.38 | -0.16 |
| Sep | 9.36 | 9.11 | -0.25 |
| Oct | 7.97 | 7.60 | -0.37 |
| Nov | 7.10 | 7.05 | -0.05 |
| Dec | 6.10 | 5.41 | -0.69 |
| ⌀ Month | 8.78 | 8.48 | -0.30 |
Rain (mm)
| Month | ⌀ 1940 - 1950 | ⌀ 2013 - 2023 | +/- |
|---|---|---|---|
| Jan | 2.39 | 2.06 | -0.33 |
| Feb | 1.95 | 2.89 | 0.94 |
| Mar | 2.46 | 2.78 | 0.32 |
| Apr | 3.01 | 3.35 | 0.34 |
| May | 3.30 | 3.49 | 0.19 |
| Jun | 3.10 | 4.28 | 1.18 |
| Jul | 4.18 | 4.82 | 0.65 |
| Aug | 3.55 | 4.10 | 0.55 |
| Sep | 3.00 | 3.65 | 0.65 |
| Oct | 1.96 | 3.51 | 1.55 |
| Nov | 3.24 | 2.50 | -0.74 |
| Dec | 2.49 | 3.49 | 1.01 |
| ⌀ Month | 2.88 | 3.41 | 0.53 |
Snow (mm)
| Month | ⌀ 1940 - 1950 | ⌀ 2013 - 2023 | +/- |
|---|---|---|---|
| Jan | 0.31 | 0.44 | 0.13 |
| Feb | 0.27 | 0.40 | 0.13 |
| Mar | 0.15 | 0.31 | 0.16 |
| Apr | 0.01 | 0.00 | -0.01 |
| May | 0.00 | 0.00 | 0.00 |
| Jun | 0.00 | 0.00 | 0.00 |
| Jul | 0.00 | 0.00 | 0.00 |
| Aug | 0.00 | 0.00 | 0.00 |
| Sep | 0.00 | 0.00 | 0.00 |
| Oct | 0.00 | 0.00 | 0.00 |
| Nov | 0.00 | 0.01 | 0.01 |
| Dec | 0.13 | 0.09 | -0.04 |
| ⌀ Month | 0.07 | 0.11 | 0.03 |