Climate Change Chart of Dongguan, China
Comprehensive Climate Change Chart of Dongguan, China: Monthly Averages and Impact Trends
Explore the changing climate in Dongguan, China through data analysis and insights. Discover how temperature, rainfall, and sunshine duration have evolved over the years.
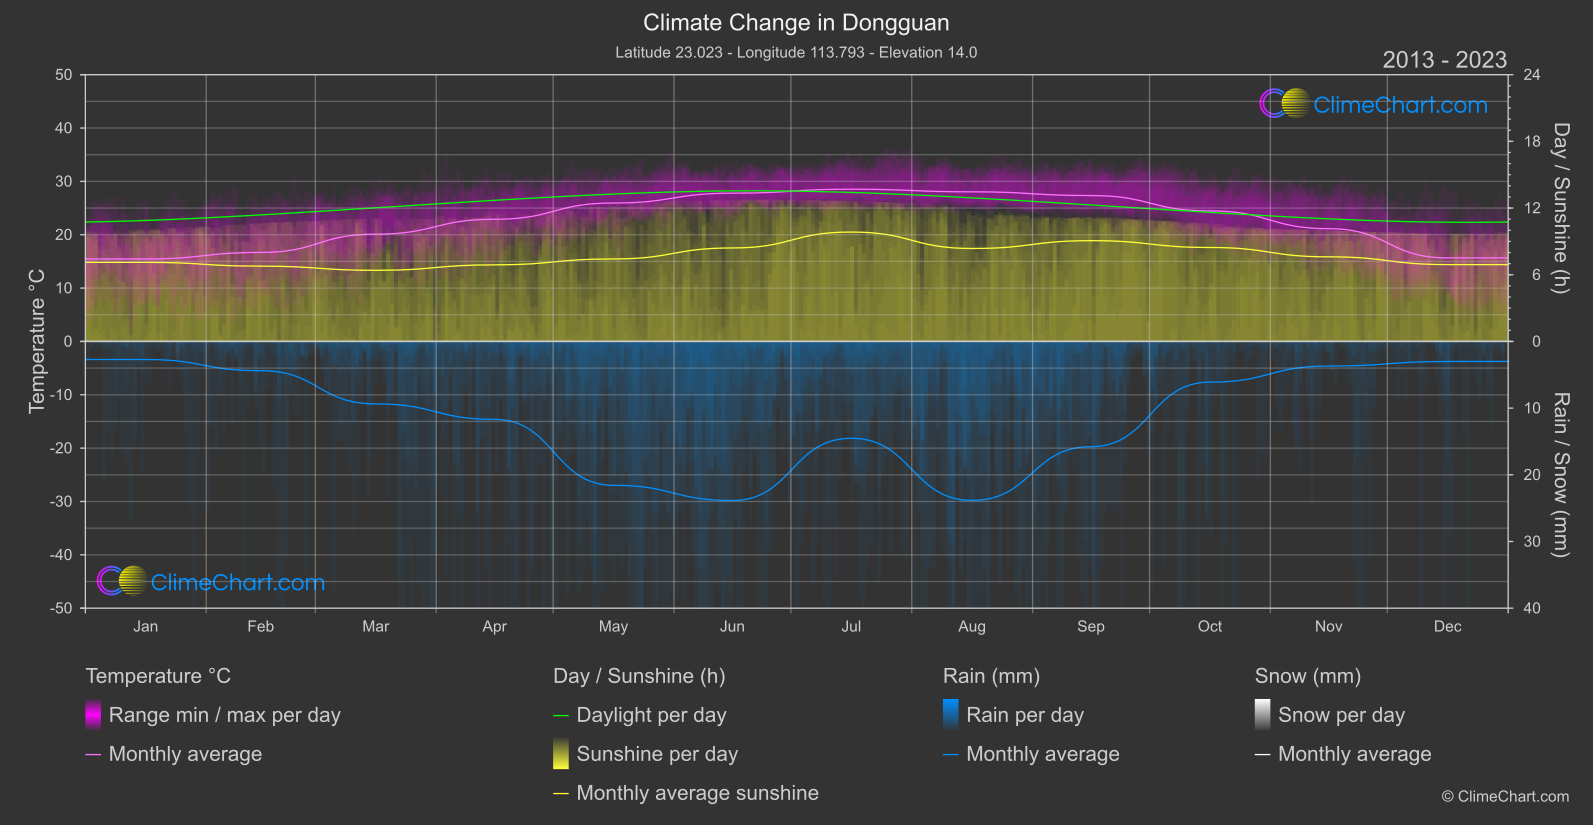
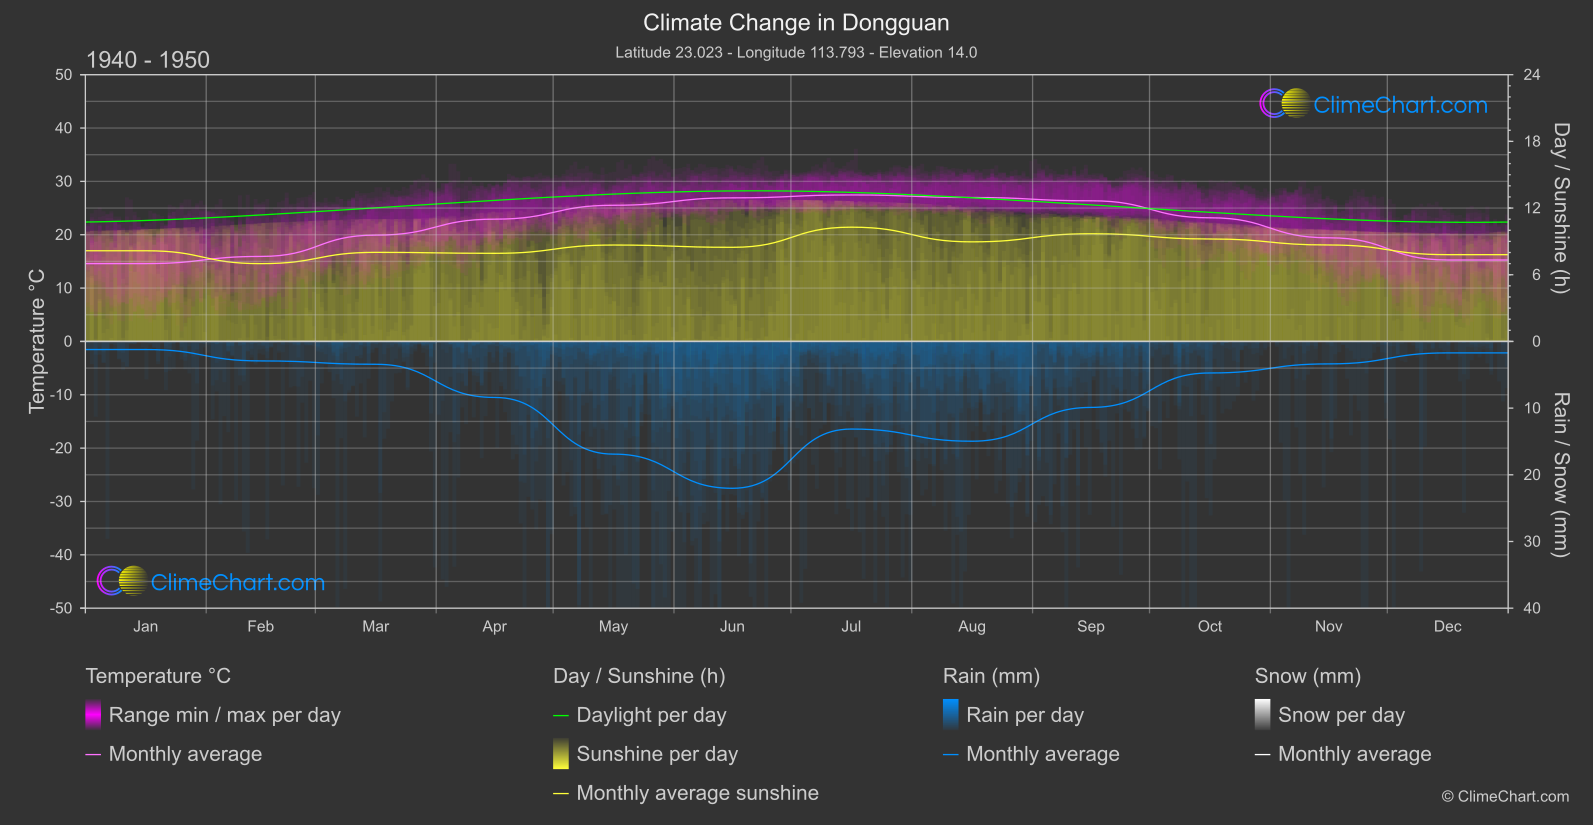
Dongguan, a city in China, has experienced significant changes in climate over the years. From 1940 to 1950 compared to 2013 to 2024, there have been noticeable shifts in temperature, rainfall, and sunshine duration. The data shows that the month with the highest temperature change is November, with a substantial increase of 1.705°C. On the other hand, March experienced the largest rainfall change, with a staggering 2.968 mm difference. Additionally, July saw a decrease in sunshine duration by 0.438 hours.
Climate Change Data Overview for Dongguan, China
Explore the comprehensive climate change data for Dongguan, China. This detailed table provides valuable insights into temperature variations, precipitation levels, and seasonal changes influenced by climate change, helping you understand the unique weather patterns of this region.
Temperature °C
| Month | ⌀ 1940 - 1950 | ⌀ 2013 - 2023 | +/- |
|---|---|---|---|
| Jan | 14.59 | 15.45 | 0.86 |
| Feb | 15.93 | 16.68 | 0.75 |
| Mar | 19.93 | 20.11 | 0.18 |
| Apr | 22.92 | 22.90 | -0.02 |
| May | 25.52 | 25.95 | 0.43 |
| Jun | 26.91 | 27.79 | 0.88 |
| Jul | 27.46 | 28.53 | 1.08 |
| Aug | 26.98 | 28.04 | 1.06 |
| Sep | 26.36 | 27.34 | 0.98 |
| Oct | 23.18 | 24.47 | 1.29 |
| Nov | 19.43 | 21.13 | 1.71 |
| Dec | 15.27 | 15.66 | 0.39 |
| ⌀ Month | 22.04 | 22.84 | 0.80 |
Sunshine (h)
| Month | ⌀ 1940 - 1950 | ⌀ 2013 - 2023 | +/- |
|---|---|---|---|
| Jan | 8.16 | 7.11 | -1.04 |
| Feb | 7.00 | 6.77 | -0.22 |
| Mar | 8.01 | 6.40 | -1.62 |
| Apr | 7.93 | 6.89 | -1.04 |
| May | 8.67 | 7.42 | -1.25 |
| Jun | 8.47 | 8.41 | -0.06 |
| Jul | 10.28 | 9.84 | -0.44 |
| Aug | 8.96 | 8.36 | -0.60 |
| Sep | 9.69 | 9.07 | -0.62 |
| Oct | 9.22 | 8.45 | -0.76 |
| Nov | 8.68 | 7.61 | -1.07 |
| Dec | 7.81 | 6.91 | -0.89 |
| ⌀ Month | 8.57 | 7.77 | -0.80 |
Rain (mm)
| Month | ⌀ 1940 - 1950 | ⌀ 2013 - 2023 | +/- |
|---|---|---|---|
| Jan | 0.61 | 1.36 | 0.75 |
| Feb | 1.46 | 2.19 | 0.73 |
| Mar | 1.71 | 4.68 | 2.97 |
| Apr | 4.20 | 5.84 | 1.64 |
| May | 8.45 | 10.79 | 2.34 |
| Jun | 11.01 | 11.93 | 0.92 |
| Jul | 6.57 | 7.26 | 0.69 |
| Aug | 7.48 | 11.92 | 4.44 |
| Sep | 4.95 | 7.89 | 2.94 |
| Oct | 2.37 | 3.05 | 0.69 |
| Nov | 1.68 | 1.84 | 0.16 |
| Dec | 0.86 | 1.50 | 0.64 |
| ⌀ Month | 4.28 | 5.86 | 1.58 |
Snow (mm)
| Month | ⌀ 1940 - 1950 | ⌀ 2013 - 2023 | +/- |
|---|---|---|---|
| Jan | 0.00 | 0.00 | 0.00 |
| Feb | 0.00 | 0.00 | 0.00 |
| Mar | 0.00 | 0.00 | 0.00 |
| Apr | 0.00 | 0.00 | 0.00 |
| May | 0.00 | 0.00 | 0.00 |
| Jun | 0.00 | 0.00 | 0.00 |
| Jul | 0.00 | 0.00 | 0.00 |
| Aug | 0.00 | 0.00 | 0.00 |
| Sep | 0.00 | 0.00 | 0.00 |
| Oct | 0.00 | 0.00 | 0.00 |
| Nov | 0.00 | 0.00 | 0.00 |
| Dec | 0.00 | 0.00 | 0.00 |
| ⌀ Month | 0.00 | 0.00 | 0.00 |