Climate Change Chart of Des Moines, USA
Comprehensive Climate Change Chart of Des Moines, USA: Monthly Averages and Impact Trends
Exploring the climate changes in Des Moines, USA reveals intriguing insights into temperature, rainfall, snowfall, and sunshine duration over the years.
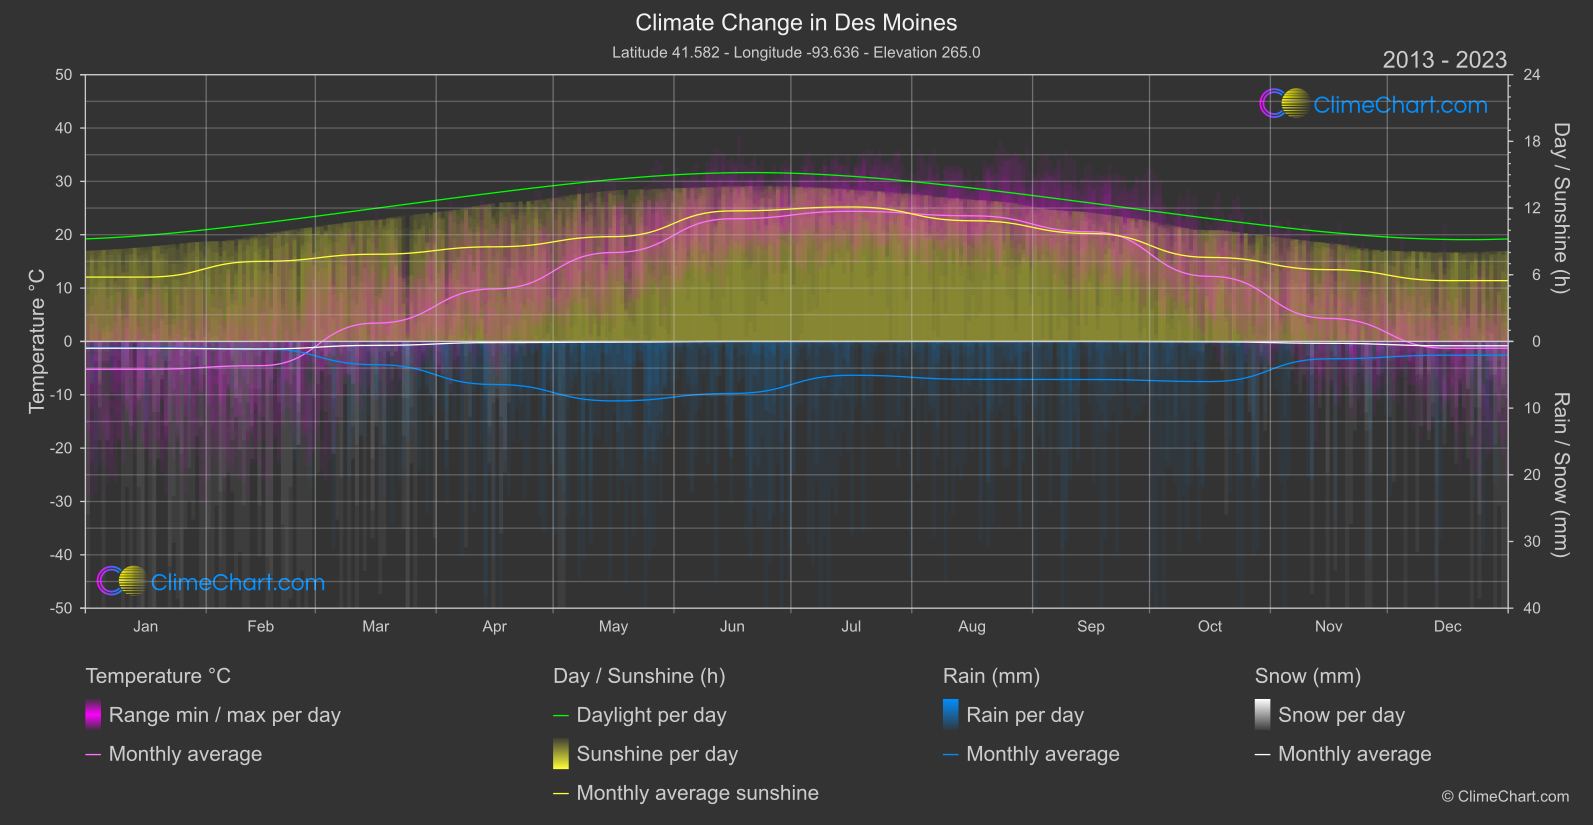
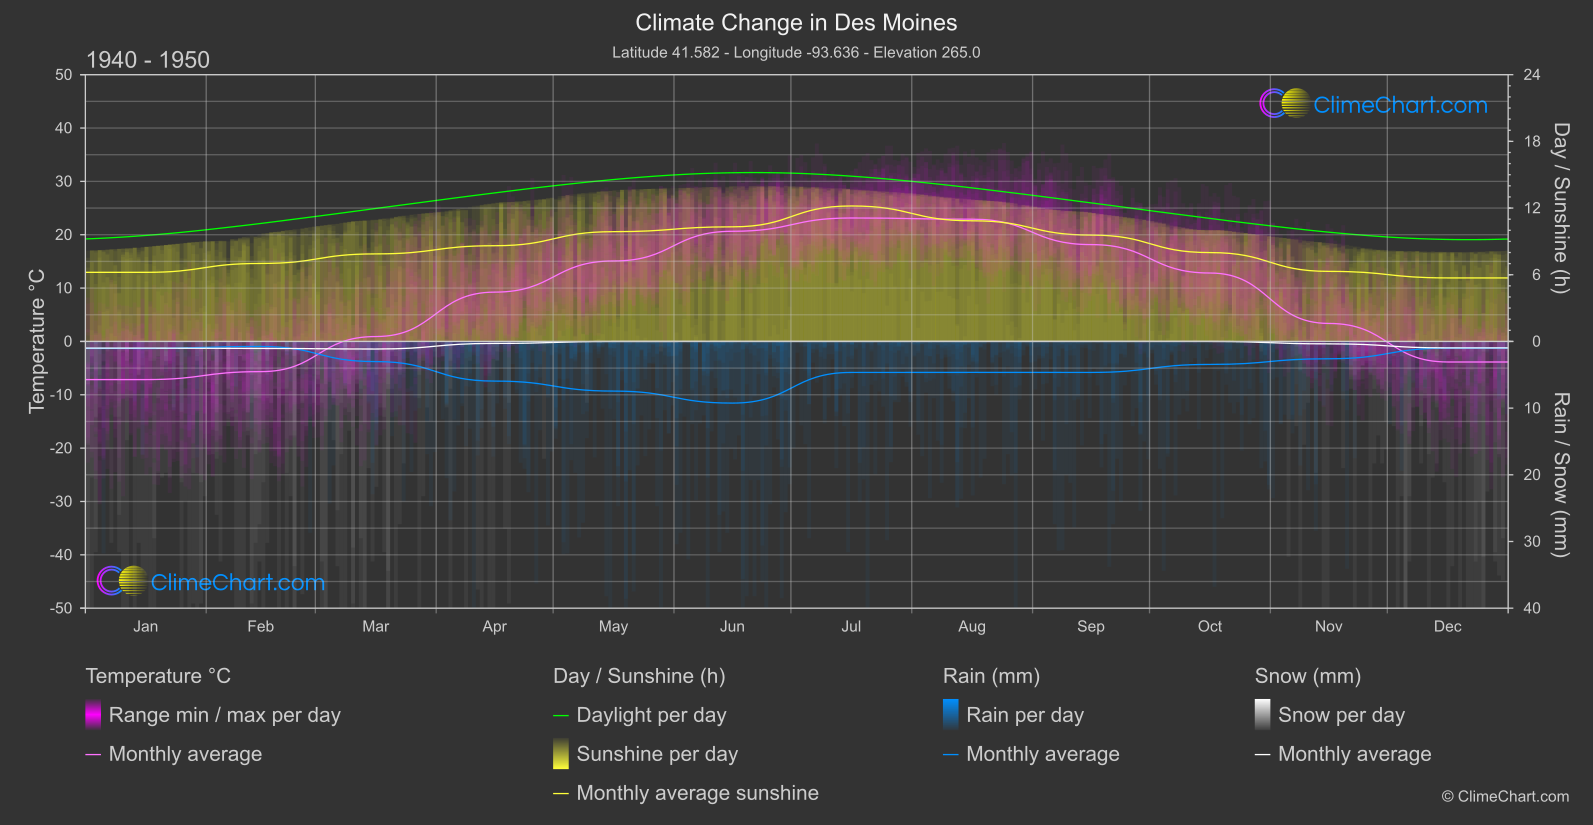
Des Moines, USA has witnessed shifts in climate patterns over the decades. From January to December, the data showcases changes in temperature, rainfall, snowfall, and sunshine duration. Notably, the month with the highest temperature change between the two periods is March, with a significant increase of 2.514°C. In terms of rainfall, the month of October experienced the most substantial increase of 1.285mm. Interestingly, snowfall in Des Moines has decreased overall, with March showing the most significant drop of -0.274mm. Sunshine duration also fluctuated, with June exhibiting the largest increase in hours of sunshine at 1.432 hours.
Climate Change Data Overview for Des Moines, USA
Explore the comprehensive climate change data for Des Moines, USA. This detailed table provides valuable insights into temperature variations, precipitation levels, and seasonal changes influenced by climate change, helping you understand the unique weather patterns of this region.
Temperature °C
| Month | ⌀ 1940 - 1950 | ⌀ 2013 - 2023 | +/- |
|---|---|---|---|
| Jan | -7.15 | -5.22 | 1.94 |
| Feb | -5.66 | -4.54 | 1.12 |
| Mar | 0.92 | 3.43 | 2.51 |
| Apr | 9.24 | 9.85 | 0.61 |
| May | 15.08 | 16.66 | 1.58 |
| Jun | 20.65 | 22.99 | 2.35 |
| Jul | 23.14 | 24.39 | 1.25 |
| Aug | 22.91 | 23.54 | 0.63 |
| Sep | 18.15 | 20.55 | 2.40 |
| Oct | 12.82 | 12.20 | -0.63 |
| Nov | 3.37 | 4.32 | 0.95 |
| Dec | -3.85 | -1.27 | 2.58 |
| ⌀ Month | 9.14 | 10.58 | 1.44 |
Sunshine (h)
| Month | ⌀ 1940 - 1950 | ⌀ 2013 - 2023 | +/- |
|---|---|---|---|
| Jan | 6.22 | 5.79 | -0.43 |
| Feb | 7.02 | 7.20 | 0.19 |
| Mar | 7.88 | 7.84 | -0.03 |
| Apr | 8.61 | 8.51 | -0.10 |
| May | 9.88 | 9.43 | -0.45 |
| Jun | 10.31 | 11.74 | 1.43 |
| Jul | 12.19 | 12.10 | -0.09 |
| Aug | 10.85 | 10.86 | 0.00 |
| Sep | 9.57 | 9.71 | 0.14 |
| Oct | 8.00 | 7.56 | -0.44 |
| Nov | 6.30 | 6.46 | 0.16 |
| Dec | 5.71 | 5.47 | -0.24 |
| ⌀ Month | 8.54 | 8.56 | 0.01 |
Rain (mm)
| Month | ⌀ 1940 - 1950 | ⌀ 2013 - 2023 | +/- |
|---|---|---|---|
| Jan | 0.53 | 0.48 | -0.04 |
| Feb | 0.38 | 0.54 | 0.16 |
| Mar | 1.51 | 1.74 | 0.23 |
| Apr | 2.97 | 3.23 | 0.26 |
| May | 3.72 | 4.46 | 0.74 |
| Jun | 4.62 | 3.90 | -0.72 |
| Jul | 2.32 | 2.54 | 0.21 |
| Aug | 2.32 | 2.84 | 0.52 |
| Sep | 2.32 | 2.85 | 0.53 |
| Oct | 1.72 | 3.01 | 1.29 |
| Nov | 1.30 | 1.30 | 0.00 |
| Dec | 0.50 | 1.03 | 0.53 |
| ⌀ Month | 2.02 | 2.33 | 0.31 |
Snow (mm)
| Month | ⌀ 1940 - 1950 | ⌀ 2013 - 2023 | +/- |
|---|---|---|---|
| Jan | 0.50 | 0.51 | 0.01 |
| Feb | 0.53 | 0.57 | 0.04 |
| Mar | 0.57 | 0.29 | -0.27 |
| Apr | 0.15 | 0.09 | -0.06 |
| May | 0.00 | 0.05 | 0.05 |
| Jun | 0.00 | 0.00 | 0.00 |
| Jul | 0.00 | 0.00 | 0.00 |
| Aug | 0.00 | 0.00 | 0.00 |
| Sep | 0.00 | 0.00 | 0.00 |
| Oct | 0.00 | 0.03 | 0.03 |
| Nov | 0.18 | 0.14 | -0.04 |
| Dec | 0.49 | 0.32 | -0.16 |
| ⌀ Month | 0.20 | 0.17 | -0.03 |