Climate Change Chart of Denver, USA
Comprehensive Climate Change Chart of Denver, USA: Monthly Averages and Impact Trends
Explore the changing climate in Denver, USA through detailed data analysis.
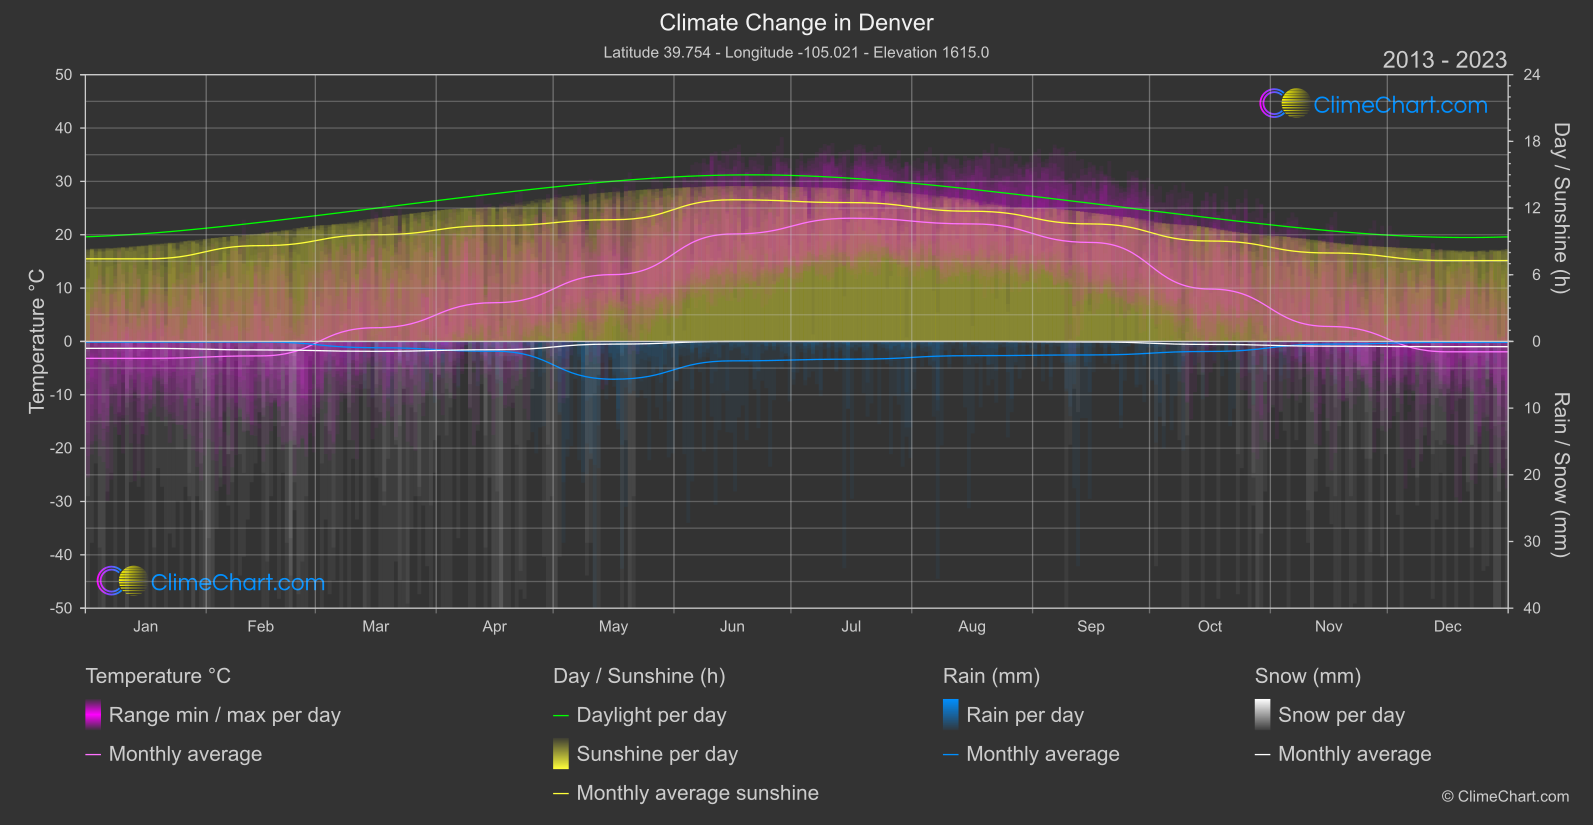
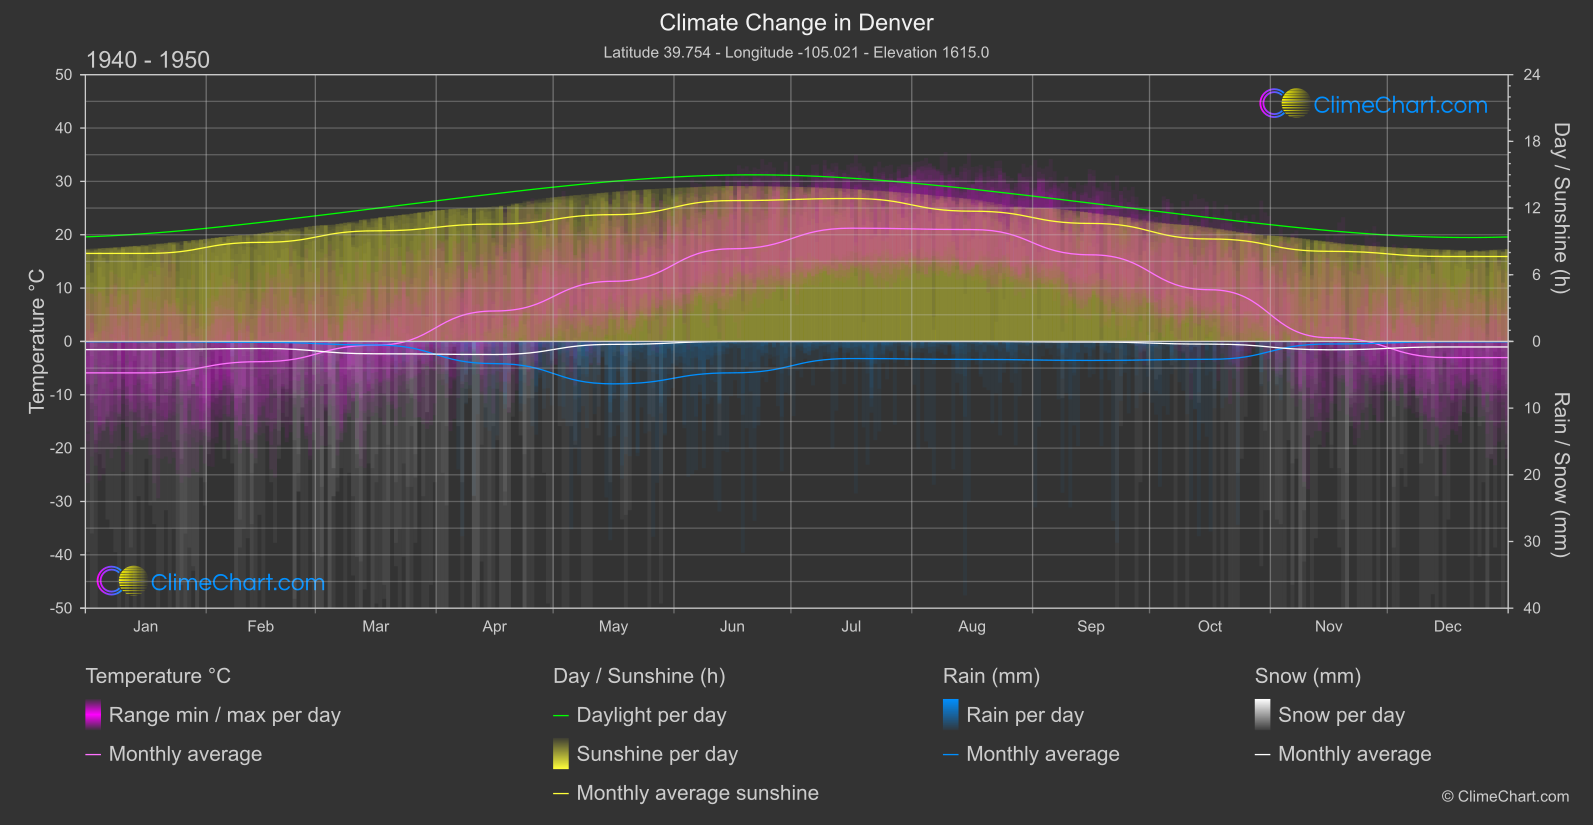
Denver, located in the heart of the United States, experiences notable temperature shifts and rainfall changes over the years. From January to December, significant variations in temperature and precipitation can be observed. Notably, June shows the highest increase in temperature, while April exhibits a considerable decrease in rainfall. This data sheds light on the evolving climate patterns in Denver, USA.
Climate Change Data Overview for Denver, USA
Explore the comprehensive climate change data for Denver, USA. This detailed table provides valuable insights into temperature variations, precipitation levels, and seasonal changes influenced by climate change, helping you understand the unique weather patterns of this region.
Temperature °C
| Month | ⌀ 1940 - 1950 | ⌀ 2013 - 2023 | +/- |
|---|---|---|---|
| Jan | -5.89 | -3.17 | 2.72 |
| Feb | -3.79 | -2.71 | 1.08 |
| Mar | -0.69 | 2.57 | 3.26 |
| Apr | 5.70 | 7.26 | 1.56 |
| May | 11.27 | 12.53 | 1.25 |
| Jun | 17.37 | 20.13 | 2.77 |
| Jul | 21.23 | 23.10 | 1.87 |
| Aug | 20.97 | 22.03 | 1.06 |
| Sep | 16.23 | 18.56 | 2.32 |
| Oct | 9.69 | 9.83 | 0.14 |
| Nov | 0.70 | 2.81 | 2.10 |
| Dec | -3.03 | -1.94 | 1.08 |
| ⌀ Month | 7.48 | 9.25 | 1.77 |
Sunshine (h)
| Month | ⌀ 1940 - 1950 | ⌀ 2013 - 2023 | +/- |
|---|---|---|---|
| Jan | 7.92 | 7.43 | -0.49 |
| Feb | 8.91 | 8.62 | -0.29 |
| Mar | 9.95 | 9.60 | -0.35 |
| Apr | 10.56 | 10.42 | -0.14 |
| May | 11.41 | 10.95 | -0.45 |
| Jun | 12.67 | 12.74 | 0.07 |
| Jul | 12.86 | 12.49 | -0.37 |
| Aug | 11.72 | 11.71 | -0.01 |
| Sep | 10.62 | 10.57 | -0.04 |
| Oct | 9.22 | 9.04 | -0.18 |
| Nov | 8.11 | 7.96 | -0.15 |
| Dec | 7.64 | 7.27 | -0.37 |
| ⌀ Month | 10.13 | 9.90 | -0.23 |
Rain (mm)
| Month | ⌀ 1940 - 1950 | ⌀ 2013 - 2023 | +/- |
|---|---|---|---|
| Jan | 0.02 | 0.05 | 0.03 |
| Feb | 0.07 | 0.04 | -0.03 |
| Mar | 0.27 | 0.47 | 0.21 |
| Apr | 1.66 | 0.74 | -0.93 |
| May | 3.18 | 2.83 | -0.35 |
| Jun | 2.35 | 1.46 | -0.90 |
| Jul | 1.28 | 1.33 | 0.05 |
| Aug | 1.35 | 1.07 | -0.28 |
| Sep | 1.42 | 1.01 | -0.41 |
| Oct | 1.34 | 0.75 | -0.59 |
| Nov | 0.19 | 0.20 | 0.01 |
| Dec | 0.03 | 0.07 | 0.04 |
| ⌀ Month | 1.10 | 0.84 | -0.26 |
Snow (mm)
| Month | ⌀ 1940 - 1950 | ⌀ 2013 - 2023 | +/- |
|---|---|---|---|
| Jan | 0.61 | 0.52 | -0.09 |
| Feb | 0.53 | 0.64 | 0.11 |
| Mar | 0.93 | 0.74 | -0.18 |
| Apr | 0.98 | 0.62 | -0.36 |
| May | 0.22 | 0.20 | -0.02 |
| Jun | 0.00 | 0.00 | -0.00 |
| Jul | 0.00 | 0.00 | 0.00 |
| Aug | 0.00 | 0.00 | 0.00 |
| Sep | 0.05 | 0.04 | -0.01 |
| Oct | 0.20 | 0.22 | 0.02 |
| Nov | 0.62 | 0.35 | -0.27 |
| Dec | 0.41 | 0.39 | -0.02 |
| ⌀ Month | 0.38 | 0.31 | -0.07 |