Climate Change Chart of Damascus, Syrian Arab Republic
Comprehensive Climate Change Chart of Damascus, Syrian Arab Republic: Monthly Averages and Impact Trends
Explore the changing climate in Damascus, Syrian Arab Republic, with insights into the temperature, rainfall, snowfall, and sunshine duration trends over the years.
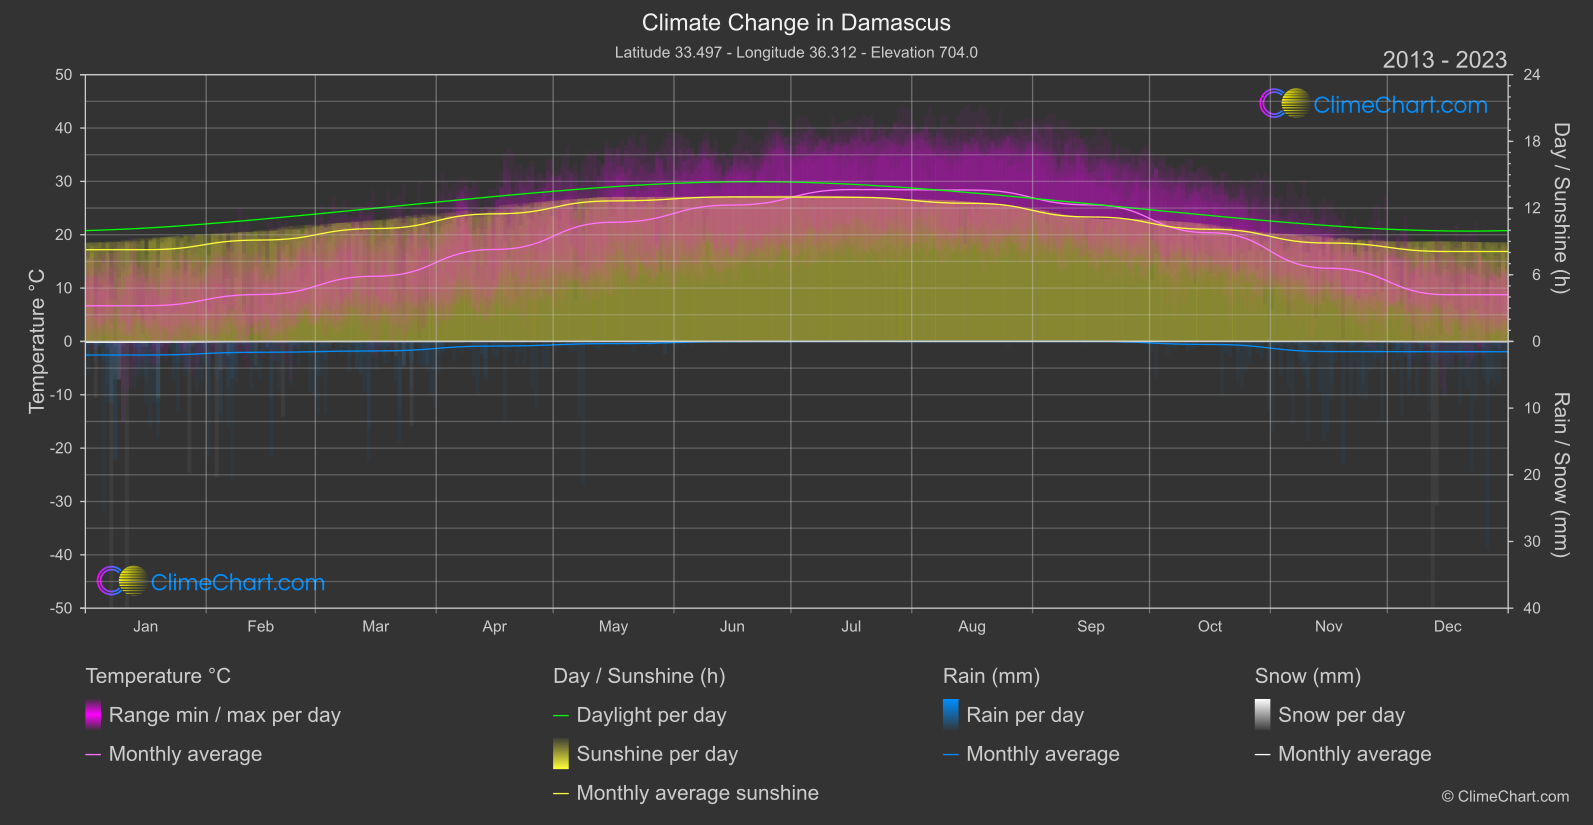
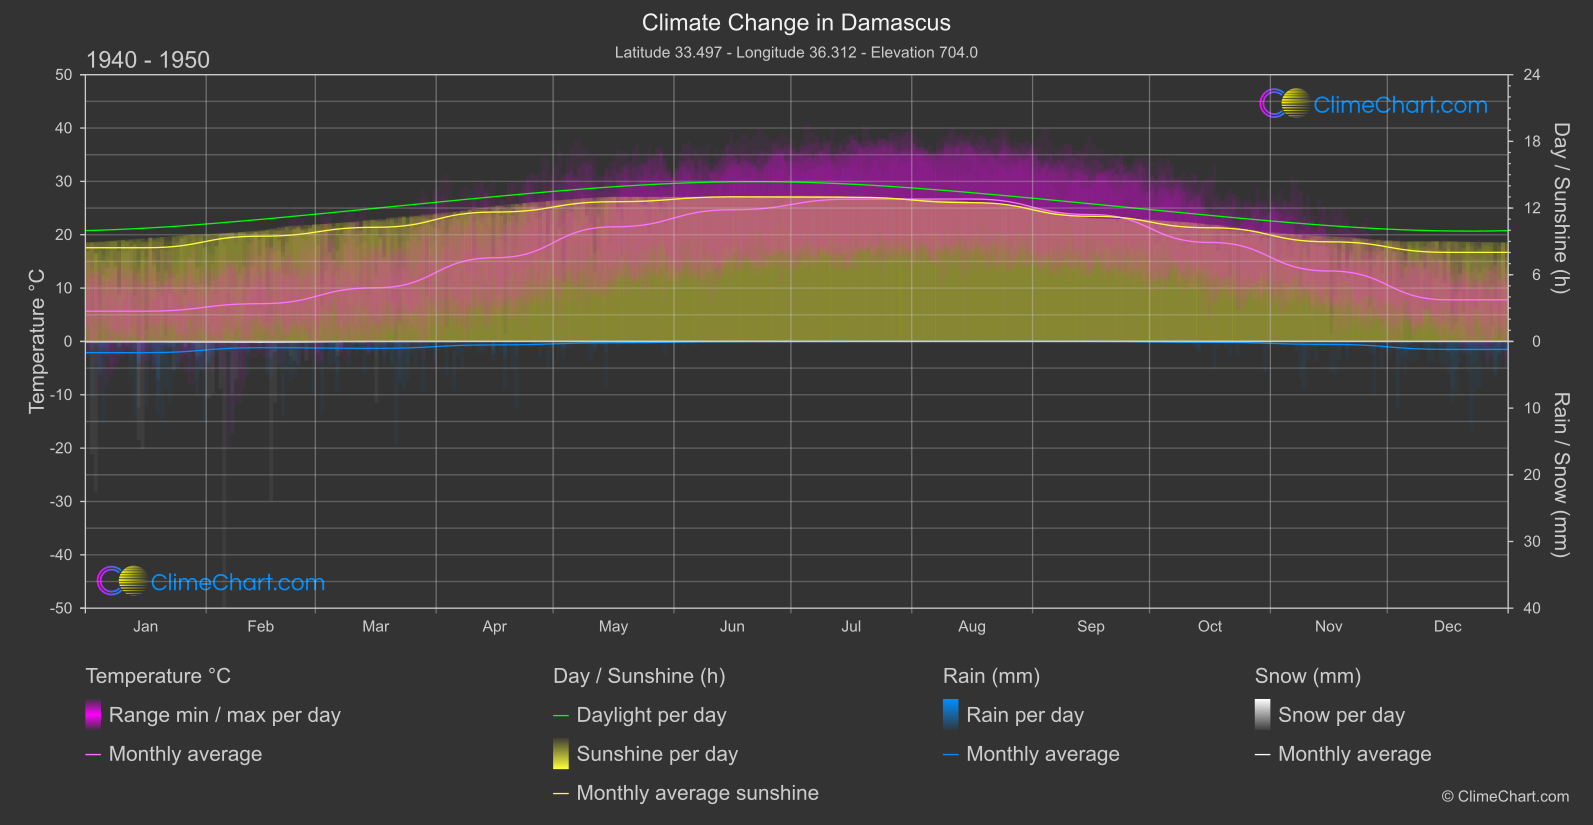
Damascus, the capital of Syria, experiences noticeable changes in climate indicators. From the data provided, it is evident that the temperatures have been consistently rising, with March showing the highest temperature change of approximately 2.17°C. In terms of rainfall, November has seen a significant increase in precipitation of around 0.54mm. Snowfall remains minimal throughout the years, while the duration of sunshine has shown variations, with May experiencing a slight increase in sunshine duration compared to the past.
Climate Change Data Overview for Damascus, Syrian Arab Republic
Explore the comprehensive climate change data for Damascus, Syrian Arab Republic. This detailed table provides valuable insights into temperature variations, precipitation levels, and seasonal changes influenced by climate change, helping you understand the unique weather patterns of this region.
Temperature °C
| Month | ⌀ 1940 - 1950 | ⌀ 2013 - 2023 | +/- |
|---|---|---|---|
| Jan | 5.67 | 6.69 | 1.01 |
| Feb | 7.08 | 8.80 | 1.72 |
| Mar | 10.06 | 12.23 | 2.17 |
| Apr | 15.68 | 17.24 | 1.56 |
| May | 21.48 | 22.34 | 0.86 |
| Jun | 24.68 | 25.56 | 0.88 |
| Jul | 26.68 | 28.47 | 1.80 |
| Aug | 26.69 | 28.38 | 1.69 |
| Sep | 23.78 | 25.59 | 1.81 |
| Oct | 18.56 | 20.38 | 1.82 |
| Nov | 13.21 | 13.72 | 0.51 |
| Dec | 7.80 | 8.75 | 0.96 |
| ⌀ Month | 16.78 | 18.18 | 1.40 |
Sunshine (h)
| Month | ⌀ 1940 - 1950 | ⌀ 2013 - 2023 | +/- |
|---|---|---|---|
| Jan | 8.43 | 8.25 | -0.18 |
| Feb | 9.47 | 9.12 | -0.35 |
| Mar | 10.27 | 10.15 | -0.12 |
| Apr | 11.64 | 11.48 | -0.16 |
| May | 12.57 | 12.64 | 0.07 |
| Jun | 13.01 | 13.00 | -0.01 |
| Jul | 12.97 | 12.97 | 0.00 |
| Aug | 12.49 | 12.43 | -0.06 |
| Sep | 11.26 | 11.20 | -0.06 |
| Oct | 10.23 | 10.09 | -0.13 |
| Nov | 8.96 | 8.85 | -0.11 |
| Dec | 8.01 | 8.09 | 0.08 |
| ⌀ Month | 10.78 | 10.69 | -0.09 |
Rain (mm)
| Month | ⌀ 1940 - 1950 | ⌀ 2013 - 2023 | +/- |
|---|---|---|---|
| Jan | 0.84 | 1.02 | 0.18 |
| Feb | 0.47 | 0.81 | 0.34 |
| Mar | 0.52 | 0.71 | 0.20 |
| Apr | 0.26 | 0.35 | 0.09 |
| May | 0.10 | 0.16 | 0.06 |
| Jun | 0.01 | 0.01 | 0.00 |
| Jul | 0.00 | 0.00 | -0.00 |
| Aug | 0.00 | 0.00 | 0.00 |
| Sep | 0.00 | 0.00 | 0.00 |
| Oct | 0.06 | 0.22 | 0.16 |
| Nov | 0.22 | 0.76 | 0.54 |
| Dec | 0.60 | 0.77 | 0.17 |
| ⌀ Month | 0.26 | 0.40 | 0.14 |
Snow (mm)
| Month | ⌀ 1940 - 1950 | ⌀ 2013 - 2023 | +/- |
|---|---|---|---|
| Jan | 0.03 | 0.06 | 0.04 |
| Feb | 0.05 | 0.01 | -0.04 |
| Mar | 0.00 | 0.01 | 0.00 |
| Apr | 0.00 | 0.00 | 0.00 |
| May | 0.00 | 0.00 | 0.00 |
| Jun | 0.00 | 0.00 | 0.00 |
| Jul | 0.00 | 0.00 | 0.00 |
| Aug | 0.00 | 0.00 | 0.00 |
| Sep | 0.00 | 0.00 | 0.00 |
| Oct | 0.00 | 0.00 | 0.00 |
| Nov | 0.00 | 0.00 | 0.00 |
| Dec | 0.00 | 0.02 | 0.02 |
| ⌀ Month | 0.01 | 0.01 | 0.00 |