Climate Change Chart of dallas, USA
Comprehensive Climate Change Chart of dallas, USA: Monthly Averages and Impact Trends
Exploring the climate changes in Dallas, USA reveals intriguing insights.
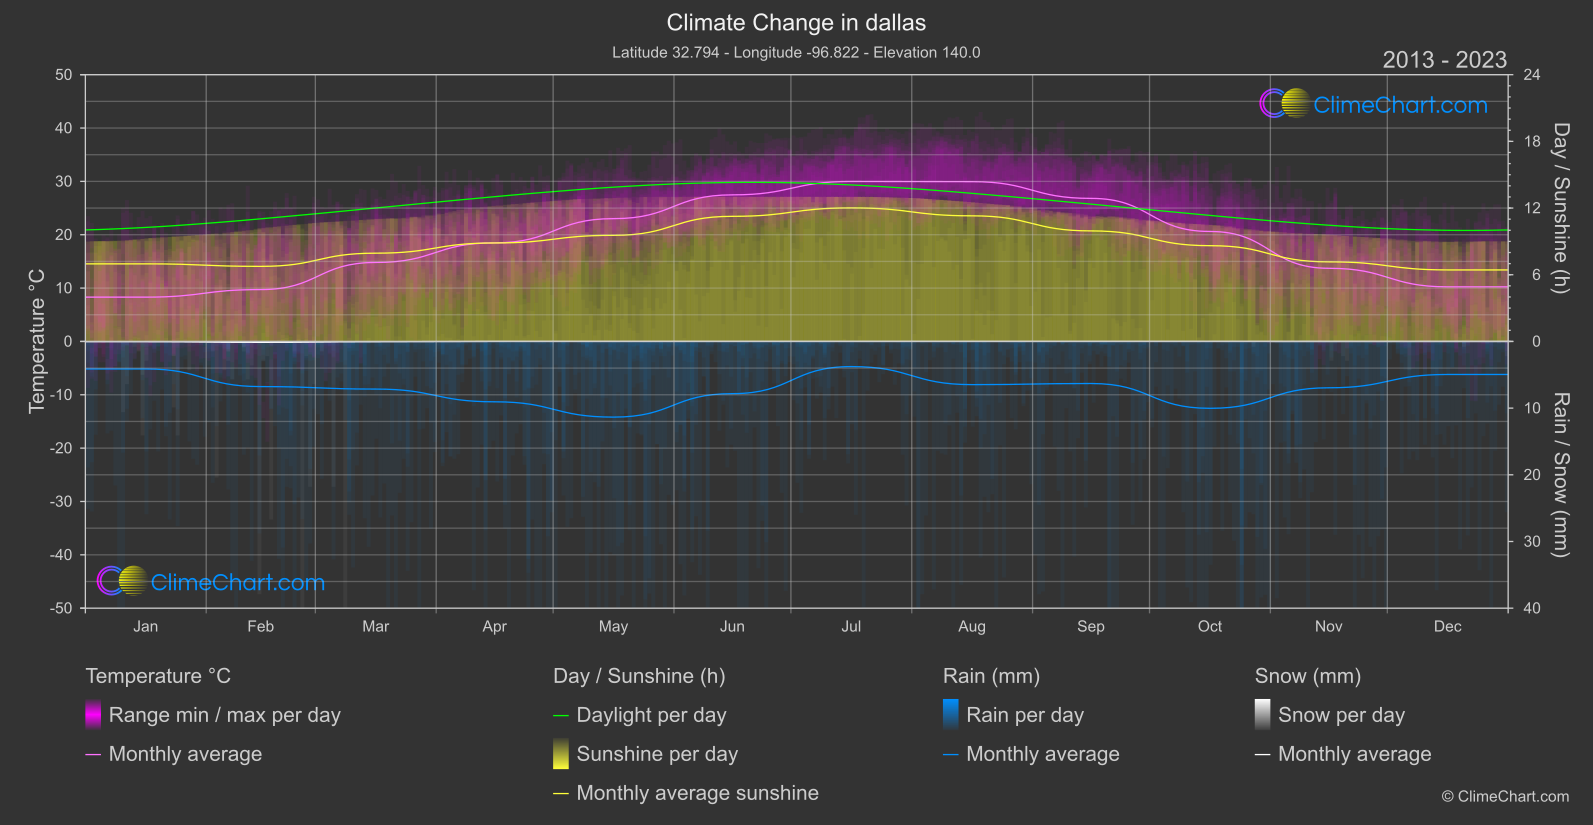
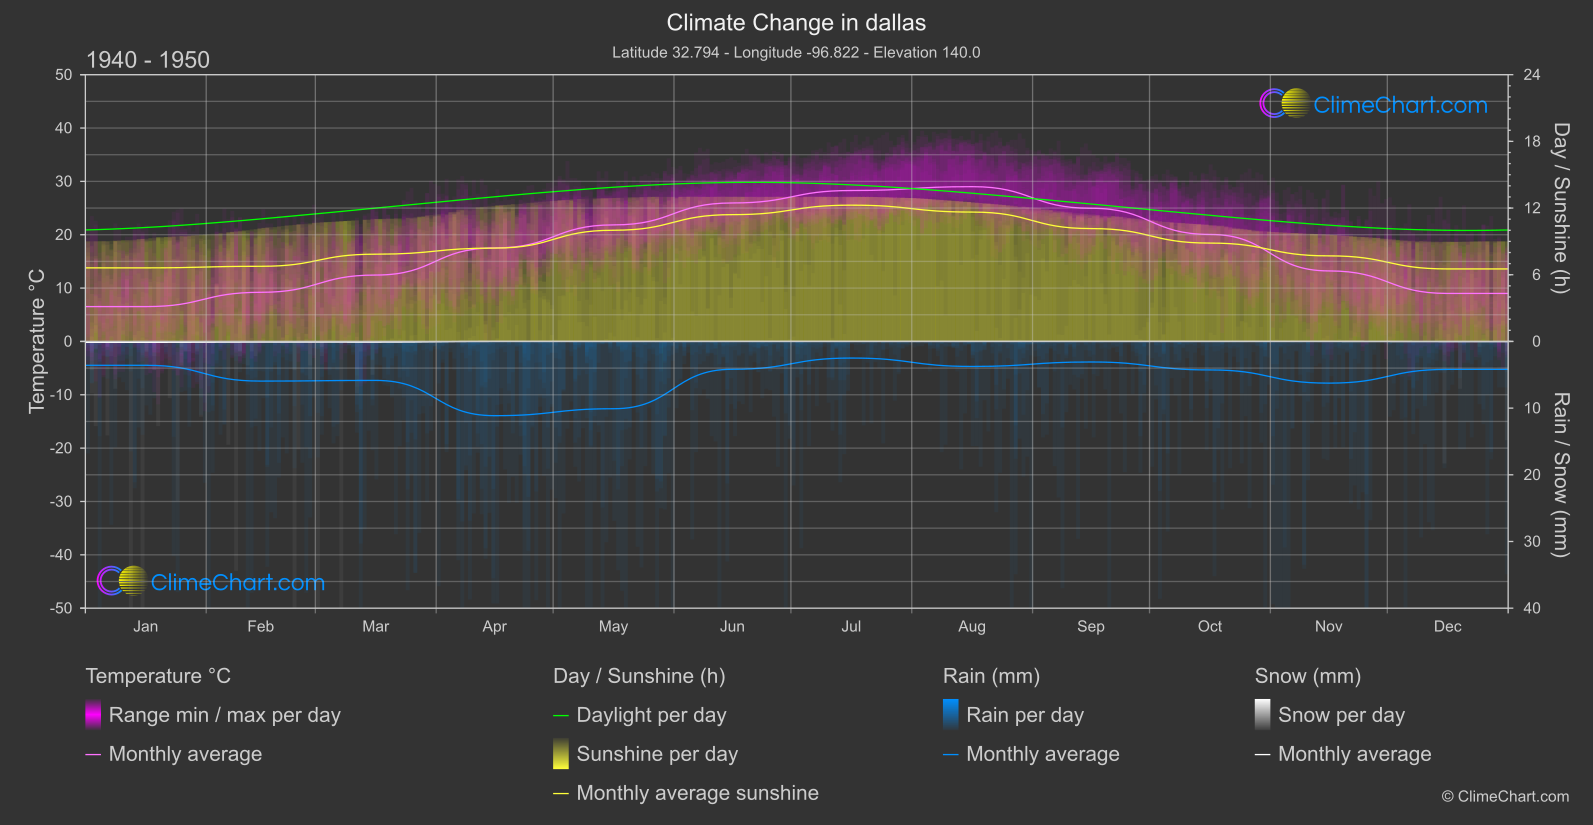
Dallas, located in the USA, has experienced notable climate changes over the years. The data from 1940 to 1950 compared to 2013 to 2024 shows a clear trend in temperature, rainfall, snowfall, and sunshine duration. Among the insights, it's interesting to note that the month of March has seen the highest temperature change of 2.36°C, while October experienced the highest rainfall change of 2.88mm. These changes reflect the impact of climate change on Dallas's weather patterns.
Climate Change Data Overview for dallas, USA
Explore the comprehensive climate change data for dallas, USA. This detailed table provides valuable insights into temperature variations, precipitation levels, and seasonal changes influenced by climate change, helping you understand the unique weather patterns of this region.
Temperature °C
| Month | ⌀ 1940 - 1950 | ⌀ 2013 - 2023 | +/- |
|---|---|---|---|
| Jan | 6.53 | 8.30 | 1.77 |
| Feb | 9.21 | 9.72 | 0.51 |
| Mar | 12.44 | 14.80 | 2.36 |
| Apr | 17.53 | 18.48 | 0.95 |
| May | 21.84 | 23.02 | 1.17 |
| Jun | 25.96 | 27.47 | 1.52 |
| Jul | 28.29 | 29.99 | 1.70 |
| Aug | 29.01 | 29.95 | 0.94 |
| Sep | 24.96 | 26.81 | 1.85 |
| Oct | 20.06 | 20.61 | 0.56 |
| Nov | 13.22 | 13.71 | 0.49 |
| Dec | 8.99 | 10.23 | 1.24 |
| ⌀ Month | 18.17 | 19.42 | 1.26 |
Sunshine (h)
| Month | ⌀ 1940 - 1950 | ⌀ 2013 - 2023 | +/- |
|---|---|---|---|
| Jan | 6.62 | 6.98 | 0.36 |
| Feb | 6.76 | 6.75 | -0.01 |
| Mar | 7.85 | 7.94 | 0.09 |
| Apr | 8.40 | 8.86 | 0.46 |
| May | 10.00 | 9.55 | -0.46 |
| Jun | 11.41 | 11.26 | -0.15 |
| Jul | 12.26 | 12.01 | -0.25 |
| Aug | 11.64 | 11.30 | -0.34 |
| Sep | 10.15 | 9.94 | -0.21 |
| Oct | 8.85 | 8.62 | -0.23 |
| Nov | 7.70 | 7.16 | -0.54 |
| Dec | 6.52 | 6.43 | -0.09 |
| ⌀ Month | 9.01 | 8.90 | -0.11 |
Rain (mm)
| Month | ⌀ 1940 - 1950 | ⌀ 2013 - 2023 | +/- |
|---|---|---|---|
| Jan | 1.79 | 2.06 | 0.27 |
| Feb | 2.97 | 3.39 | 0.41 |
| Mar | 2.92 | 3.57 | 0.65 |
| Apr | 5.57 | 4.53 | -1.04 |
| May | 5.05 | 5.67 | 0.63 |
| Jun | 2.09 | 3.92 | 1.83 |
| Jul | 1.25 | 1.89 | 0.64 |
| Aug | 1.88 | 3.24 | 1.36 |
| Sep | 1.54 | 3.15 | 1.61 |
| Oct | 2.14 | 5.01 | 2.88 |
| Nov | 3.13 | 3.48 | 0.35 |
| Dec | 2.10 | 2.48 | 0.38 |
| ⌀ Month | 2.70 | 3.53 | 0.83 |
Snow (mm)
| Month | ⌀ 1940 - 1950 | ⌀ 2013 - 2023 | +/- |
|---|---|---|---|
| Jan | 0.07 | 0.02 | -0.05 |
| Feb | 0.05 | 0.07 | 0.02 |
| Mar | 0.05 | 0.02 | -0.03 |
| Apr | 0.00 | 0.00 | 0.00 |
| May | 0.00 | 0.00 | 0.00 |
| Jun | 0.00 | 0.00 | 0.00 |
| Jul | 0.00 | 0.00 | 0.00 |
| Aug | 0.00 | 0.00 | 0.00 |
| Sep | 0.00 | 0.00 | 0.00 |
| Oct | 0.00 | 0.00 | 0.00 |
| Nov | 0.00 | 0.00 | 0.00 |
| Dec | 0.01 | 0.00 | -0.01 |
| ⌀ Month | 0.02 | 0.01 | -0.01 |