Climate Change Chart of Dalian, China
Comprehensive Climate Change Chart of Dalian, China: Monthly Averages and Impact Trends
Exploring the climate changes in Dalian, China reveals intriguing insights into temperature, rainfall, snowfall, and sunshine duration over the years.
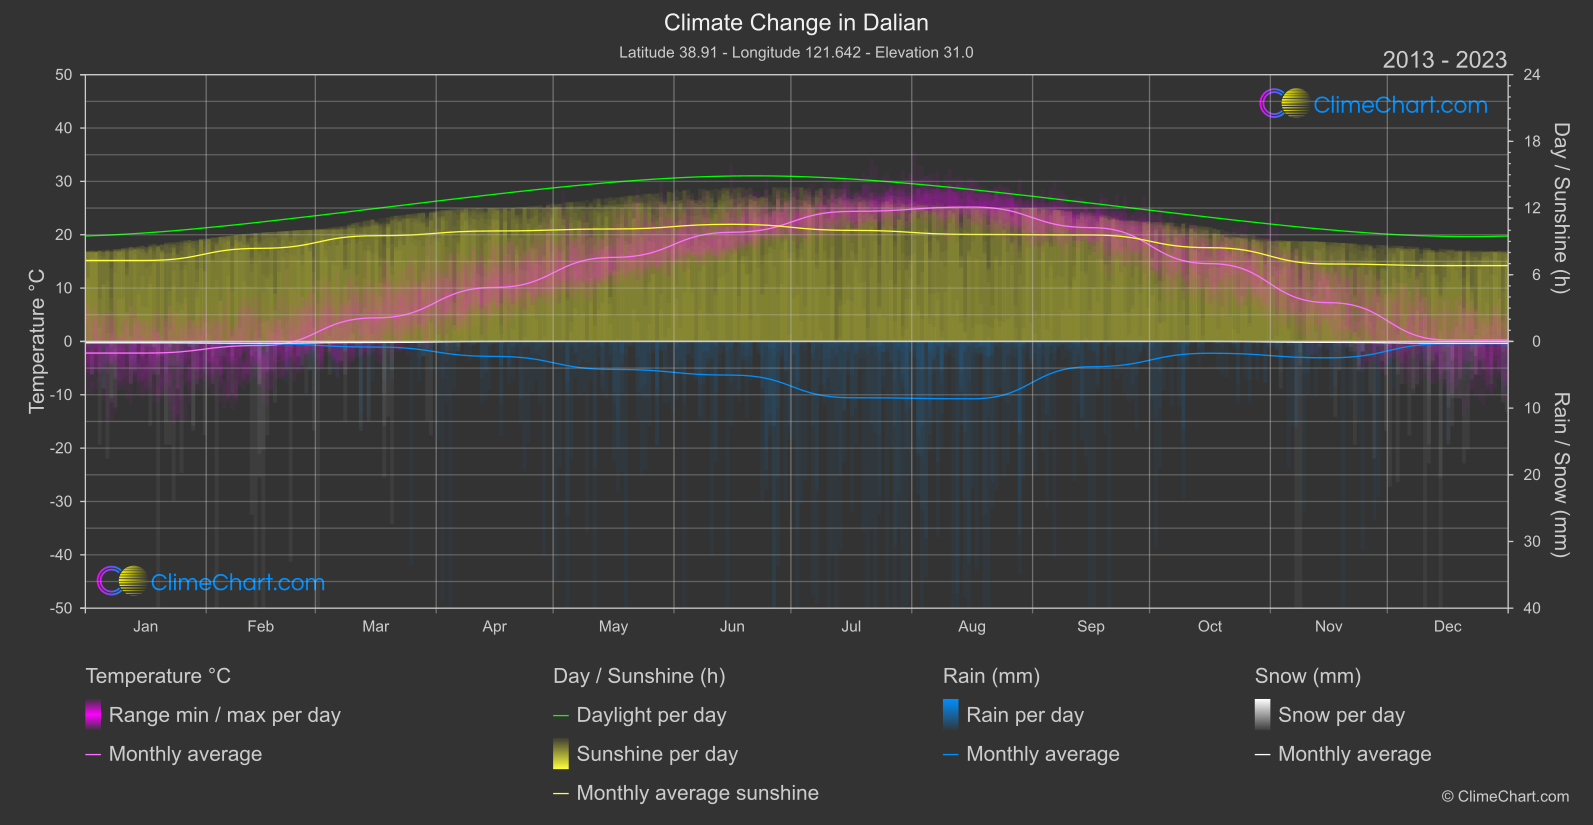
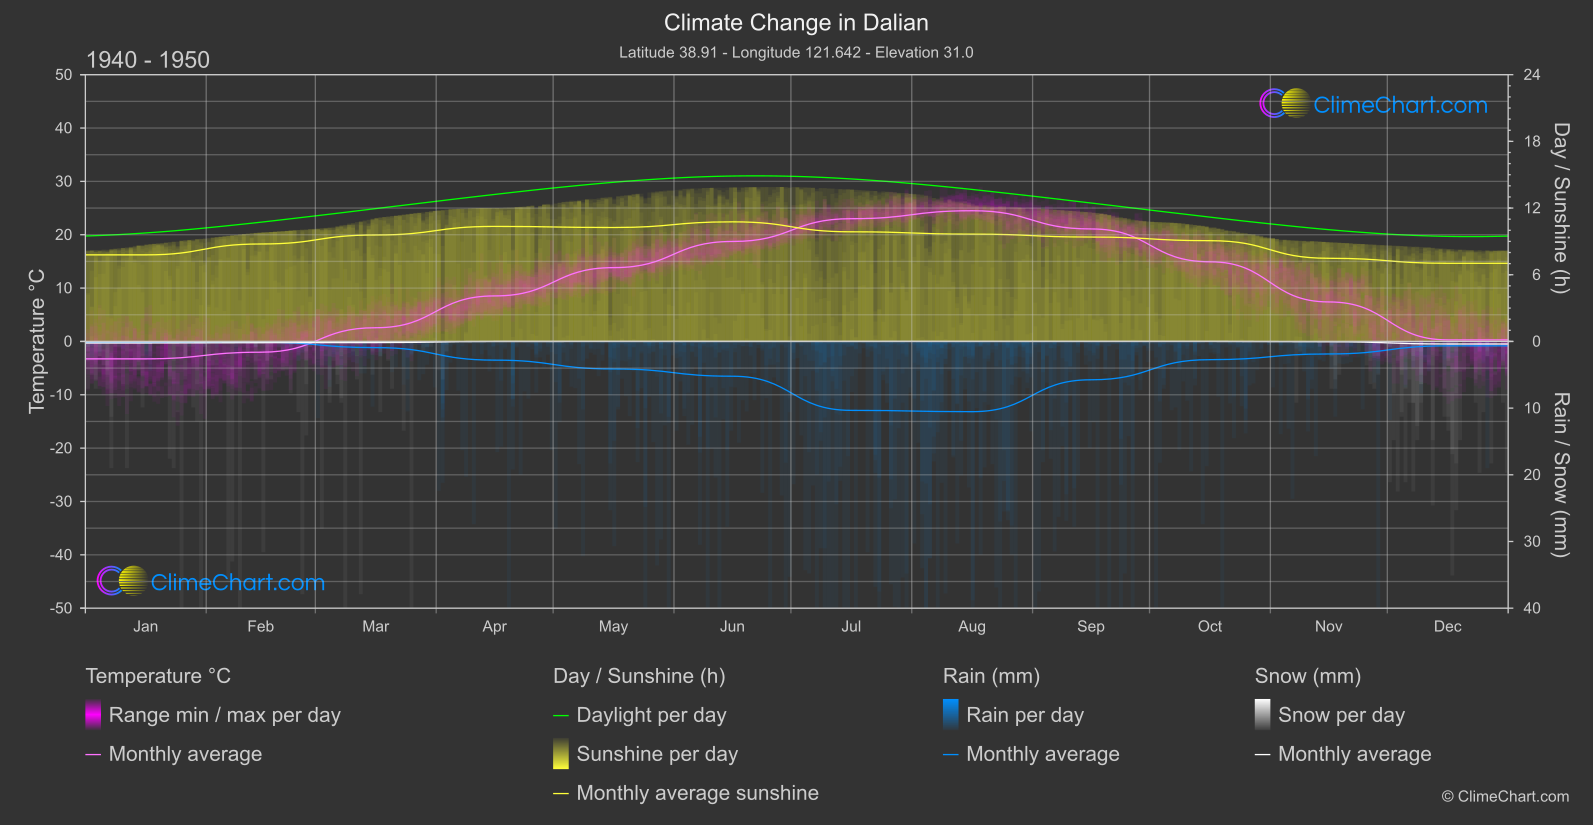
Dalian, a coastal city in China, has experienced notable changes in climate over the years. The data shows that from 1940 to 1950, the temperature in Dalian has increased, with the month of March showing the highest change. On the other hand, rainfall has fluctuated, with July experiencing a significant decrease in precipitation levels. Snowfall has generally decreased across the months, while sunshine duration has seen variations with some months showing a decrease in sunlight hours compared to earlier years.
Climate Change Data Overview for Dalian, China
Explore the comprehensive climate change data for Dalian, China. This detailed table provides valuable insights into temperature variations, precipitation levels, and seasonal changes influenced by climate change, helping you understand the unique weather patterns of this region.
Temperature °C
| Month | ⌀ 1940 - 1950 | ⌀ 2013 - 2023 | +/- |
|---|---|---|---|
| Jan | -3.27 | -2.18 | 1.09 |
| Feb | -2.02 | -0.76 | 1.26 |
| Mar | 2.57 | 4.42 | 1.85 |
| Apr | 8.53 | 10.12 | 1.59 |
| May | 13.83 | 15.76 | 1.92 |
| Jun | 18.74 | 20.47 | 1.73 |
| Jul | 23.01 | 24.38 | 1.37 |
| Aug | 24.50 | 25.19 | 0.70 |
| Sep | 21.08 | 21.33 | 0.25 |
| Oct | 14.93 | 14.58 | -0.35 |
| Nov | 7.40 | 7.26 | -0.14 |
| Dec | 0.29 | 0.27 | -0.02 |
| ⌀ Month | 10.80 | 11.74 | 0.94 |
Sunshine (h)
| Month | ⌀ 1940 - 1950 | ⌀ 2013 - 2023 | +/- |
|---|---|---|---|
| Jan | 7.79 | 7.29 | -0.50 |
| Feb | 8.77 | 8.38 | -0.39 |
| Mar | 9.58 | 9.51 | -0.07 |
| Apr | 10.35 | 9.94 | -0.41 |
| May | 10.25 | 10.12 | -0.13 |
| Jun | 10.76 | 10.54 | -0.22 |
| Jul | 9.86 | 9.99 | 0.13 |
| Aug | 9.65 | 9.63 | -0.03 |
| Sep | 9.39 | 9.58 | 0.19 |
| Oct | 9.06 | 8.44 | -0.63 |
| Nov | 7.48 | 6.97 | -0.51 |
| Dec | 7.03 | 6.82 | -0.21 |
| ⌀ Month | 9.16 | 8.93 | -0.23 |
Rain (mm)
| Month | ⌀ 1940 - 1950 | ⌀ 2013 - 2023 | +/- |
|---|---|---|---|
| Jan | 0.07 | 0.11 | 0.05 |
| Feb | 0.05 | 0.17 | 0.12 |
| Mar | 0.46 | 0.42 | -0.04 |
| Apr | 1.40 | 1.12 | -0.28 |
| May | 2.06 | 2.10 | 0.03 |
| Jun | 2.61 | 2.53 | -0.08 |
| Jul | 5.17 | 4.22 | -0.95 |
| Aug | 5.27 | 4.30 | -0.97 |
| Sep | 2.88 | 1.90 | -0.98 |
| Oct | 1.37 | 0.88 | -0.48 |
| Nov | 0.94 | 1.23 | 0.29 |
| Dec | 0.33 | 0.17 | -0.16 |
| ⌀ Month | 1.88 | 1.60 | -0.29 |
Snow (mm)
| Month | ⌀ 1940 - 1950 | ⌀ 2013 - 2023 | +/- |
|---|---|---|---|
| Jan | 0.12 | 0.10 | -0.02 |
| Feb | 0.10 | 0.13 | 0.04 |
| Mar | 0.09 | 0.08 | -0.01 |
| Apr | 0.00 | 0.00 | -0.00 |
| May | 0.00 | 0.00 | 0.00 |
| Jun | 0.00 | 0.00 | 0.00 |
| Jul | 0.00 | 0.00 | 0.00 |
| Aug | 0.00 | 0.00 | 0.00 |
| Sep | 0.00 | 0.00 | 0.00 |
| Oct | 0.00 | 0.00 | 0.00 |
| Nov | 0.02 | 0.07 | 0.05 |
| Dec | 0.19 | 0.14 | -0.06 |
| ⌀ Month | 0.04 | 0.04 | -0.00 |