Climate Change Chart of Crested Butte, USA
Comprehensive Climate Change Chart of Crested Butte, USA: Monthly Averages and Impact Trends
Explore the changing climate in Crested Butte, USA, through insightful data analysis. Discover how temperatures, rainfall, snowfall, and sunshine duration have evolved over the years.
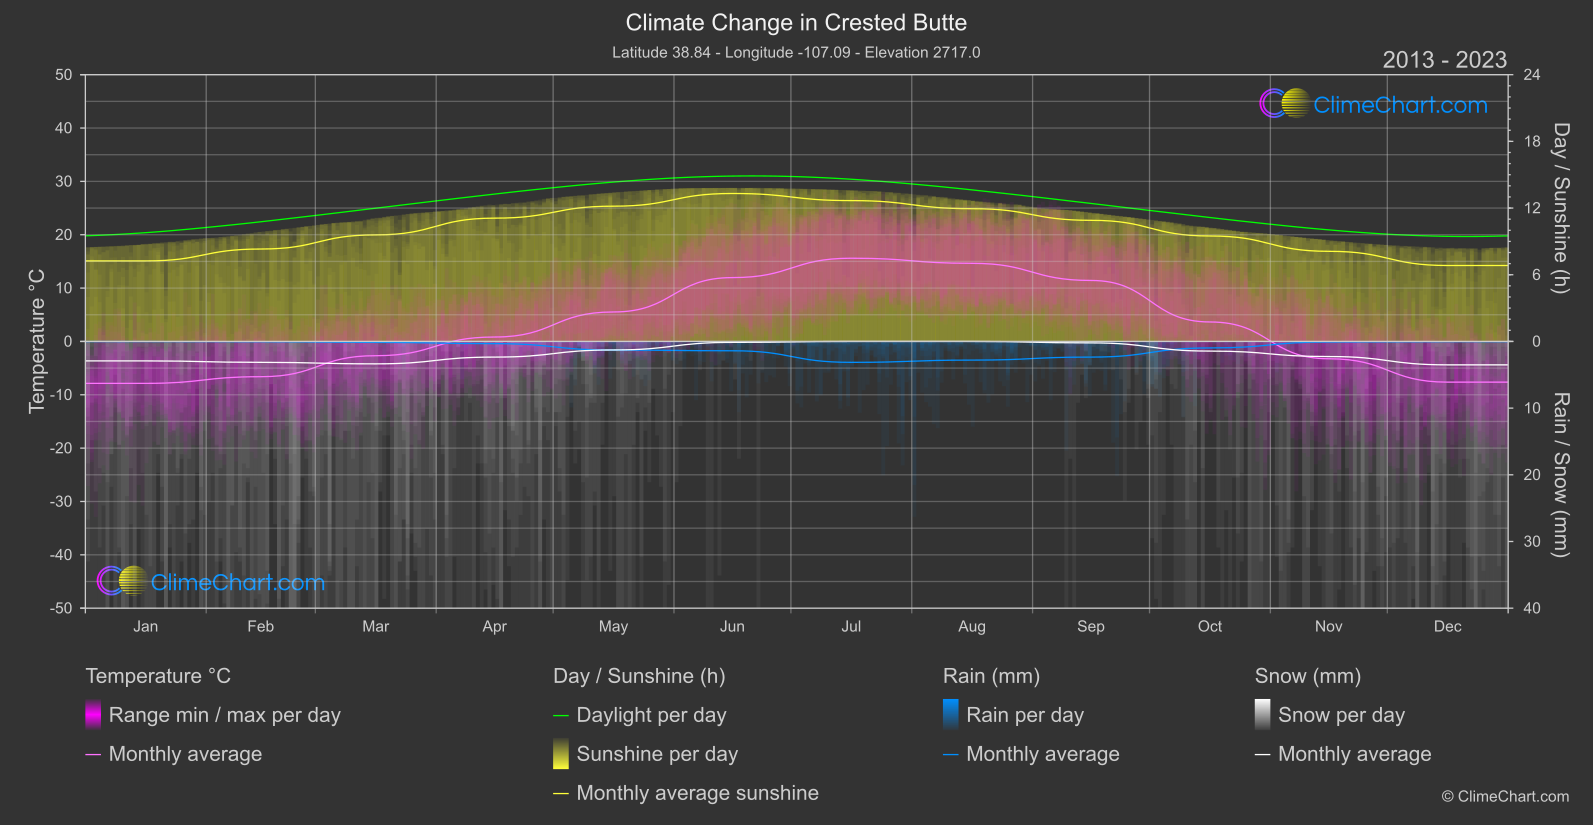
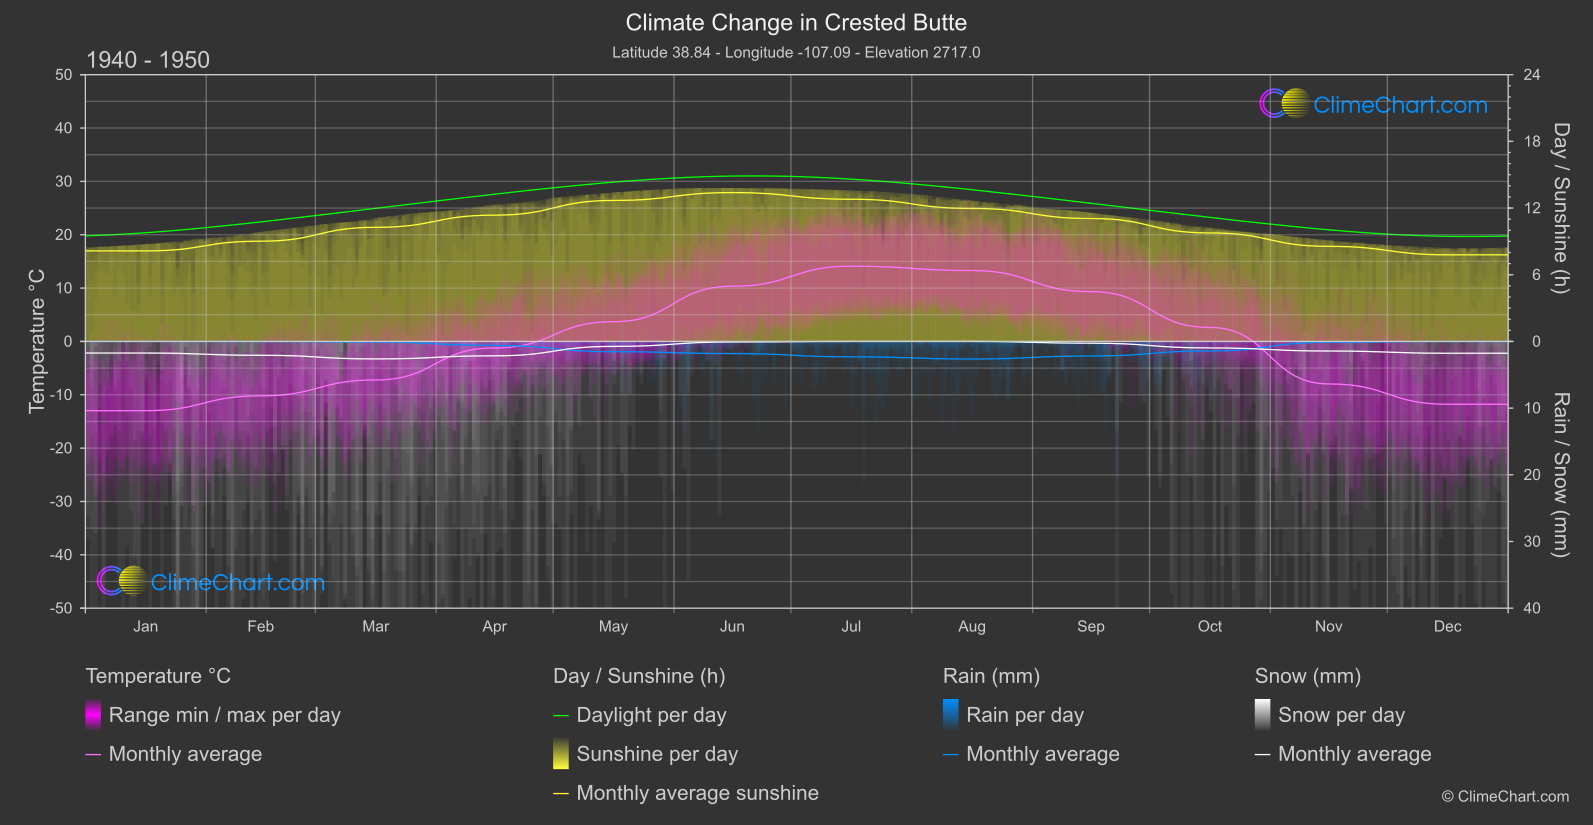
Crested Butte, located in the USA, has experienced notable changes in its climate. From the comparison of temperature, rainfall, snowfall, and sunshine duration data between 1940-1950 and 2013-2024, it is evident that the region has undergone significant shifts in weather patterns. For instance, the month with the highest temperature change is March, with a difference of 5.12°C, while July experienced the most substantial increase in rainfall with a change of 0.42mm. Snowfall in December showed the largest change of 0.87mm, and sunshine duration in December saw a decrease of 0.96 hours, indicating shifts in seasonal weather patterns in Crested Butte.
Climate Change Data Overview for Crested Butte, USA
Explore the comprehensive climate change data for Crested Butte, USA. This detailed table provides valuable insights into temperature variations, precipitation levels, and seasonal changes influenced by climate change, helping you understand the unique weather patterns of this region.
Temperature °C
| Month | ⌀ 1940 - 1950 | ⌀ 2013 - 2023 | +/- |
|---|---|---|---|
| Jan | -12.98 | -7.86 | 5.12 |
| Feb | -10.20 | -6.61 | 3.59 |
| Mar | -7.22 | -2.67 | 4.54 |
| Apr | -1.21 | 0.83 | 2.04 |
| May | 3.70 | 5.52 | 1.82 |
| Jun | 10.35 | 11.96 | 1.62 |
| Jul | 14.11 | 15.60 | 1.49 |
| Aug | 13.29 | 14.64 | 1.35 |
| Sep | 9.34 | 11.43 | 2.09 |
| Oct | 2.62 | 3.65 | 1.03 |
| Nov | -7.97 | -3.25 | 4.72 |
| Dec | -11.78 | -7.63 | 4.15 |
| ⌀ Month | 0.17 | 2.97 | 2.80 |
Sunshine (h)
| Month | ⌀ 1940 - 1950 | ⌀ 2013 - 2023 | +/- |
|---|---|---|---|
| Jan | 8.14 | 7.24 | -0.90 |
| Feb | 9.02 | 8.31 | -0.71 |
| Mar | 10.27 | 9.59 | -0.68 |
| Apr | 11.36 | 11.09 | -0.27 |
| May | 12.69 | 12.17 | -0.52 |
| Jun | 13.39 | 13.31 | -0.08 |
| Jul | 12.79 | 12.67 | -0.12 |
| Aug | 11.96 | 11.94 | -0.02 |
| Sep | 11.06 | 10.90 | -0.16 |
| Oct | 9.76 | 9.49 | -0.27 |
| Nov | 8.55 | 8.11 | -0.45 |
| Dec | 7.79 | 6.83 | -0.96 |
| ⌀ Month | 10.57 | 10.14 | -0.43 |
Rain (mm)
| Month | ⌀ 1940 - 1950 | ⌀ 2013 - 2023 | +/- |
|---|---|---|---|
| Jan | 0.00 | 0.01 | 0.00 |
| Feb | 0.01 | 0.02 | 0.01 |
| Mar | 0.05 | 0.07 | 0.03 |
| Apr | 0.30 | 0.16 | -0.14 |
| May | 0.77 | 0.65 | -0.12 |
| Jun | 0.91 | 0.70 | -0.21 |
| Jul | 1.15 | 1.57 | 0.42 |
| Aug | 1.32 | 1.40 | 0.08 |
| Sep | 1.09 | 1.17 | 0.08 |
| Oct | 0.71 | 0.49 | -0.22 |
| Nov | 0.06 | 0.04 | -0.02 |
| Dec | 0.01 | 0.01 | 0.01 |
| ⌀ Month | 0.53 | 0.52 | -0.01 |
Snow (mm)
| Month | ⌀ 1940 - 1950 | ⌀ 2013 - 2023 | +/- |
|---|---|---|---|
| Jan | 0.87 | 1.46 | 0.59 |
| Feb | 1.04 | 1.57 | 0.53 |
| Mar | 1.31 | 1.68 | 0.37 |
| Apr | 1.08 | 1.17 | 0.10 |
| May | 0.37 | 0.64 | 0.27 |
| Jun | 0.04 | 0.07 | 0.03 |
| Jul | 0.00 | 0.00 | 0.00 |
| Aug | 0.00 | 0.00 | 0.00 |
| Sep | 0.13 | 0.11 | -0.02 |
| Oct | 0.49 | 0.72 | 0.24 |
| Nov | 0.72 | 1.13 | 0.41 |
| Dec | 0.89 | 1.76 | 0.87 |
| ⌀ Month | 0.58 | 0.86 | 0.28 |