Climate Change Chart of Courchevel, France
Comprehensive Climate Change Chart of Courchevel, France: Monthly Averages and Impact Trends
Explore the changing climate in Courchevel, France with insights from temperature, rainfall, snowfall, and sunshine duration data. Discover how the climate has evolved from 1940 - 1950 to 2013 - 2024.
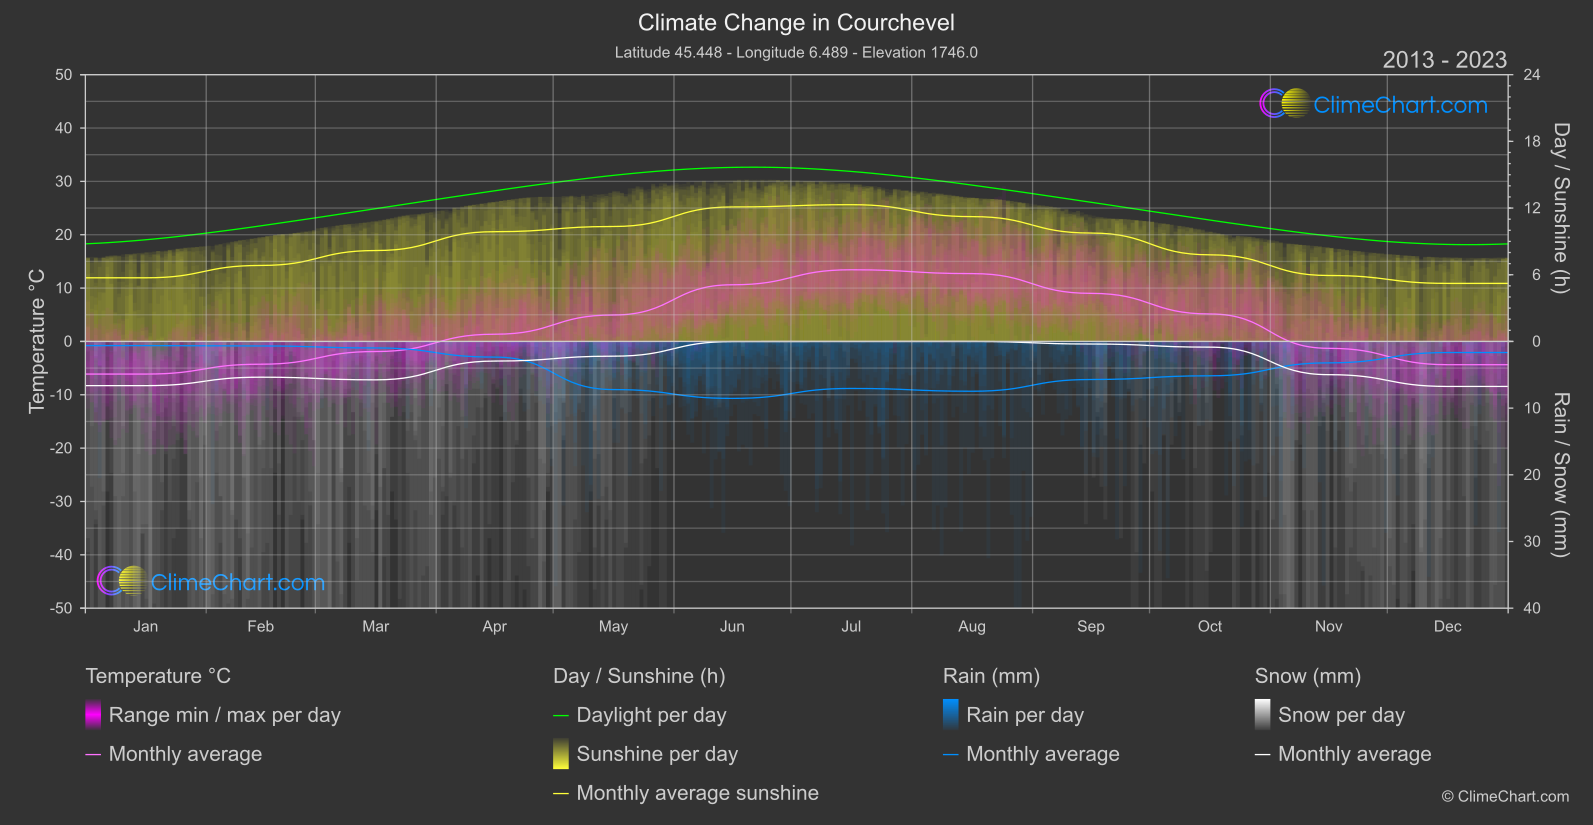
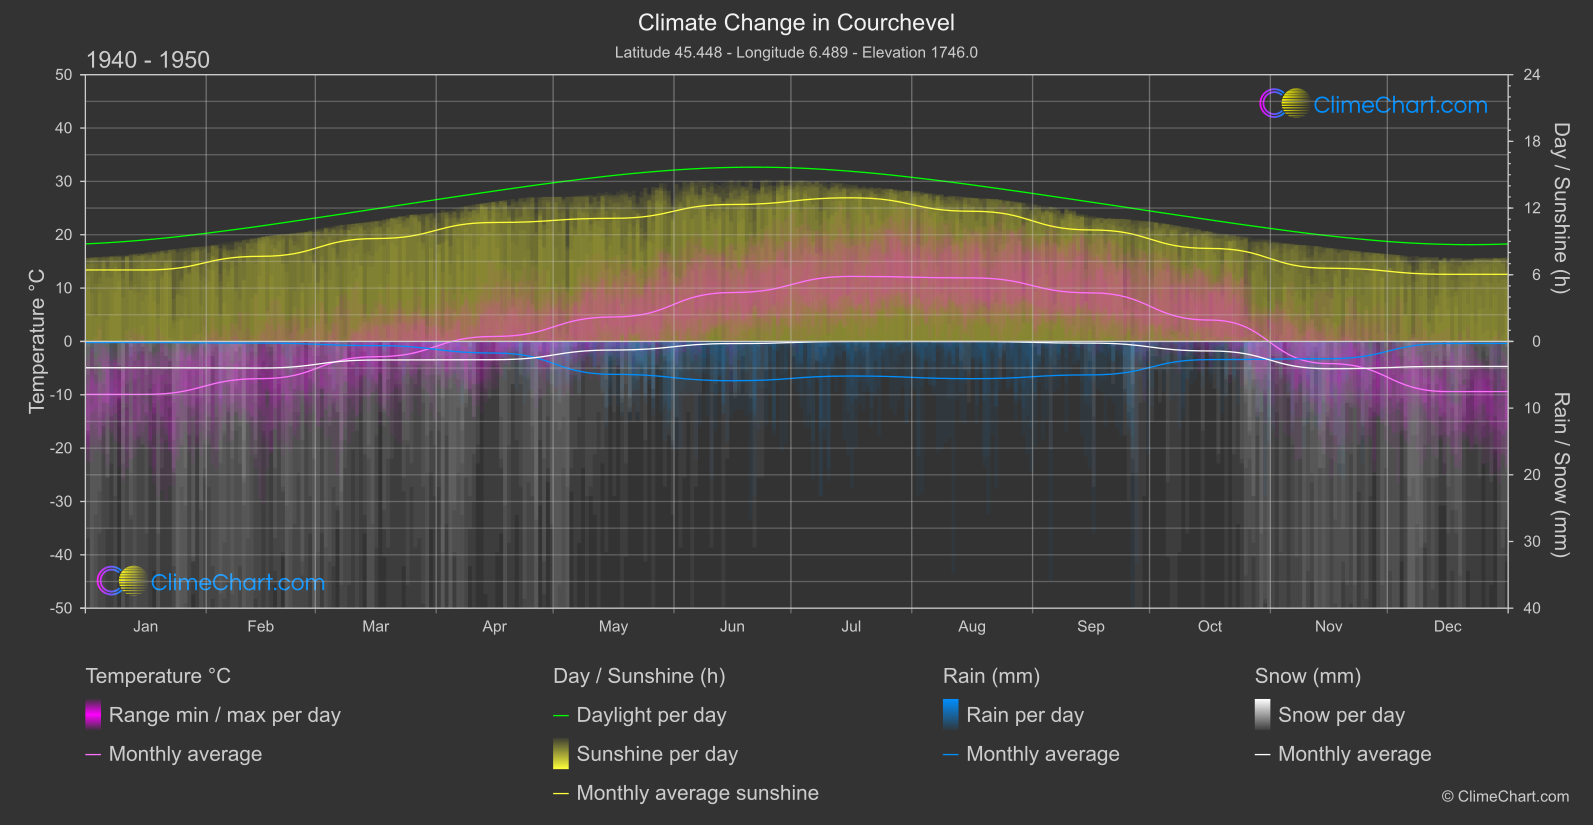
Discover detailed insights into climate and weather changes in Courchevel, France, with comparisons of temperature, rainfall, snowfall, and sunshine duration from 1940 - 1950 to 2013 - 2024. Analyze the data to understand the evolving climate patterns over the years.
Climate Change Data Overview for Courchevel, France
Explore the comprehensive climate change data for Courchevel, France. This detailed table provides valuable insights into temperature variations, precipitation levels, and seasonal changes influenced by climate change, helping you understand the unique weather patterns of this region.
Temperature °C
| Month | ⌀ 1940 - 1950 | ⌀ 2013 - 2023 | +/- |
|---|---|---|---|
| Jan | -9.92 | -6.12 | 3.80 |
| Feb | -6.98 | -4.27 | 2.71 |
| Mar | -2.87 | -1.89 | 0.98 |
| Apr | 0.93 | 1.35 | 0.42 |
| May | 4.59 | 4.96 | 0.37 |
| Jun | 9.16 | 10.62 | 1.46 |
| Jul | 12.19 | 13.43 | 1.25 |
| Aug | 11.91 | 12.71 | 0.81 |
| Sep | 9.10 | 9.01 | -0.09 |
| Oct | 4.01 | 5.15 | 1.14 |
| Nov | -4.16 | -1.29 | 2.86 |
| Dec | -9.40 | -4.36 | 5.04 |
| ⌀ Month | 1.55 | 3.28 | 1.73 |
Sunshine (h)
| Month | ⌀ 1940 - 1950 | ⌀ 2013 - 2023 | +/- |
|---|---|---|---|
| Jan | 6.43 | 5.72 | -0.71 |
| Feb | 7.66 | 6.84 | -0.82 |
| Mar | 9.26 | 8.18 | -1.08 |
| Apr | 10.70 | 9.87 | -0.83 |
| May | 11.08 | 10.34 | -0.74 |
| Jun | 12.32 | 12.10 | -0.22 |
| Jul | 12.92 | 12.30 | -0.62 |
| Aug | 11.71 | 11.23 | -0.48 |
| Sep | 10.03 | 9.75 | -0.28 |
| Oct | 8.37 | 7.79 | -0.58 |
| Nov | 6.59 | 5.93 | -0.65 |
| Dec | 6.04 | 5.22 | -0.82 |
| ⌀ Month | 9.43 | 8.77 | -0.65 |
Rain (mm)
| Month | ⌀ 1940 - 1950 | ⌀ 2013 - 2023 | +/- |
|---|---|---|---|
| Jan | 0.09 | 0.31 | 0.23 |
| Feb | 0.12 | 0.34 | 0.22 |
| Mar | 0.31 | 0.49 | 0.18 |
| Apr | 0.87 | 1.17 | 0.31 |
| May | 2.47 | 3.61 | 1.14 |
| Jun | 2.94 | 4.27 | 1.33 |
| Jul | 2.59 | 3.53 | 0.93 |
| Aug | 2.79 | 3.73 | 0.94 |
| Sep | 2.51 | 2.85 | 0.35 |
| Oct | 1.36 | 2.58 | 1.21 |
| Nov | 1.29 | 1.61 | 0.31 |
| Dec | 0.15 | 0.83 | 0.68 |
| ⌀ Month | 1.46 | 2.11 | 0.65 |
Snow (mm)
| Month | ⌀ 1940 - 1950 | ⌀ 2013 - 2023 | +/- |
|---|---|---|---|
| Jan | 1.97 | 3.32 | 1.34 |
| Feb | 2.00 | 2.68 | 0.69 |
| Mar | 1.39 | 2.88 | 1.49 |
| Apr | 1.37 | 1.47 | 0.10 |
| May | 0.64 | 1.11 | 0.46 |
| Jun | 0.16 | 0.01 | -0.15 |
| Jul | 0.00 | 0.00 | -0.00 |
| Aug | 0.01 | 0.00 | -0.01 |
| Sep | 0.13 | 0.19 | 0.07 |
| Oct | 0.71 | 0.43 | -0.29 |
| Nov | 2.05 | 2.49 | 0.45 |
| Dec | 1.87 | 3.37 | 1.50 |
| ⌀ Month | 1.03 | 1.50 | 0.47 |