Climate Change Chart of Corsica, France
Comprehensive Climate Change Chart of Corsica, France: Monthly Averages and Impact Trends
Discover the changing climate in Corsica, France with insights from temperature, rainfall, snowfall, and sunshine duration data. Explore how the climate has evolved from 1940-1950 to 2013-2024.
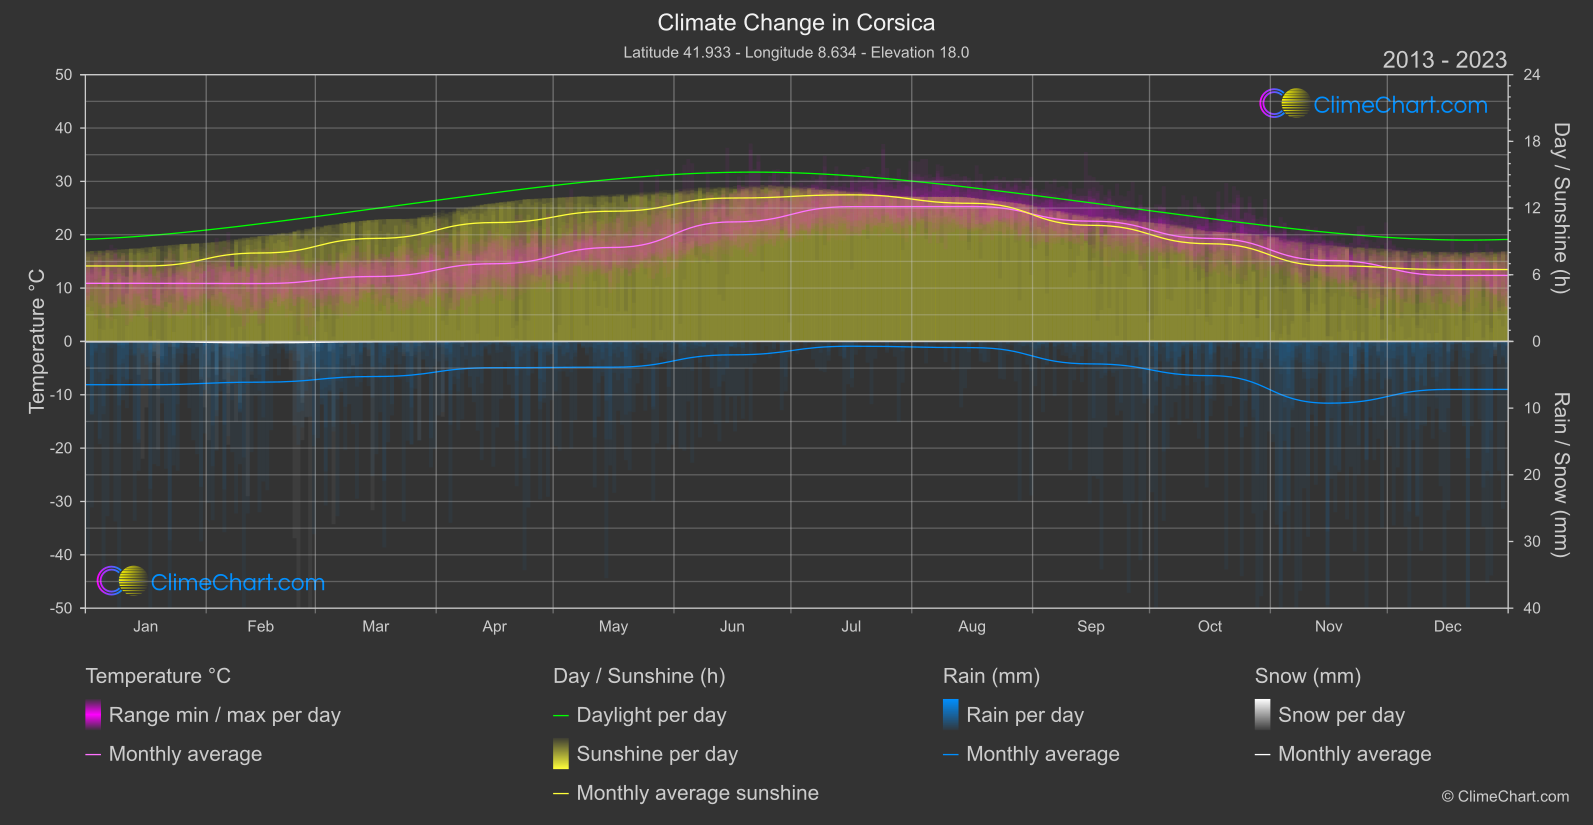
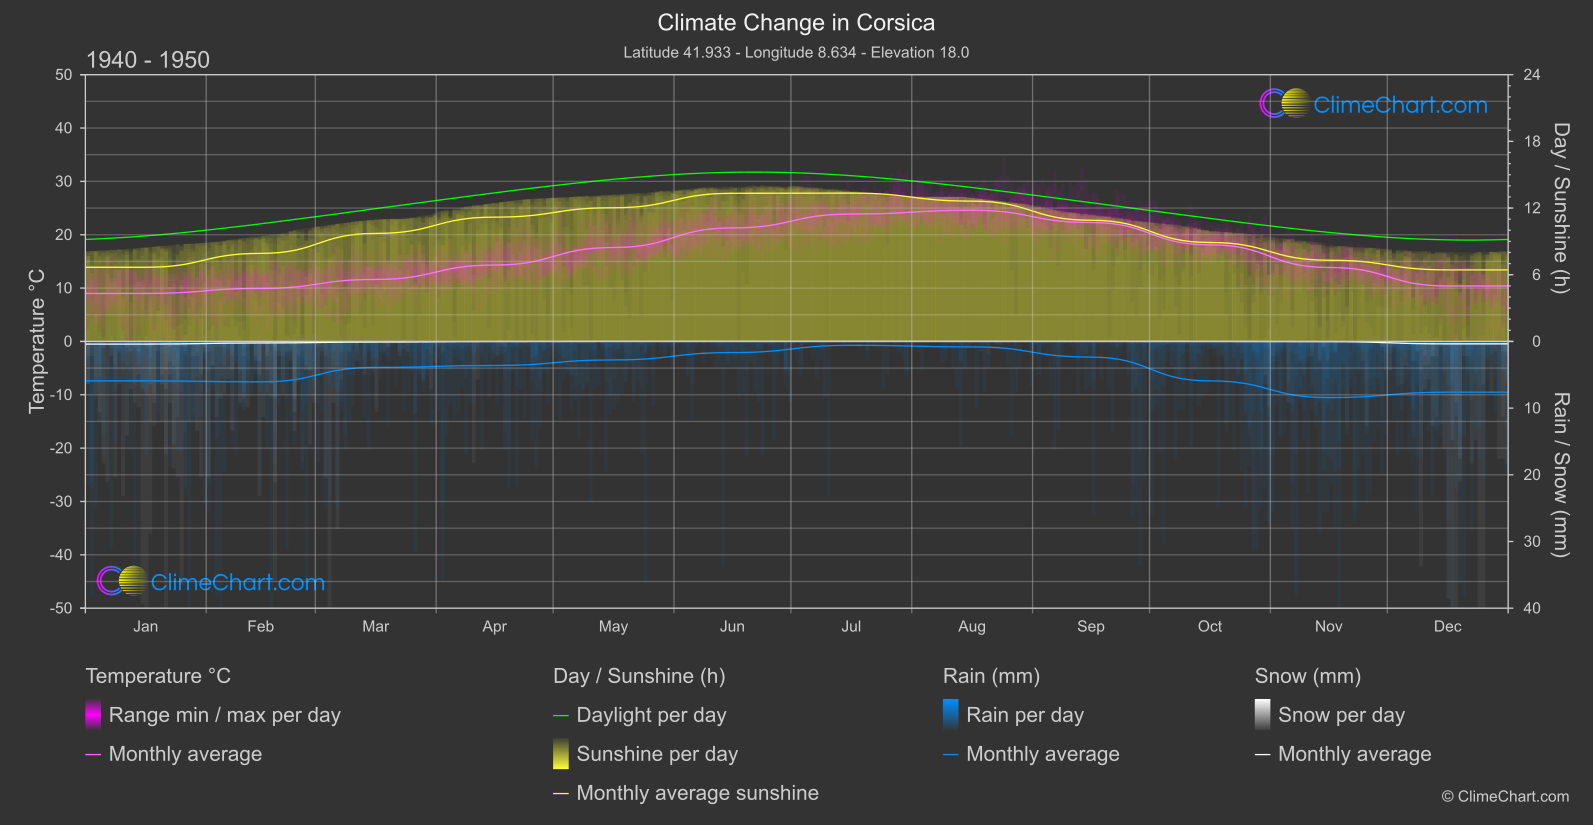
Corsica, a beautiful island in France, has experienced significant climate changes over the years. From the temperature data, it is evident that June and July have shown the highest temperature increases, with over 1°C rise compared to the past. In terms of rainfall, the data indicates that September has seen the most significant increase in precipitation with over 50% more rain than before. Snowfall has notably decreased across all months, with December experiencing the most significant decline in snow accumulation. Additionally, sunshine duration has decreased in most months, particularly in September and November, indicating less sunlight exposure in these months.
Climate Change Data Overview for Corsica, France
Explore the comprehensive climate change data for Corsica, France. This detailed table provides valuable insights into temperature variations, precipitation levels, and seasonal changes influenced by climate change, helping you understand the unique weather patterns of this region.
Temperature °C
| Month | ⌀ 1940 - 1950 | ⌀ 2013 - 2023 | +/- |
|---|---|---|---|
| Jan | 8.99 | 10.89 | 1.90 |
| Feb | 9.93 | 10.85 | 0.91 |
| Mar | 11.62 | 12.17 | 0.55 |
| Apr | 14.32 | 14.56 | 0.24 |
| May | 17.61 | 17.62 | 0.01 |
| Jun | 21.28 | 22.40 | 1.12 |
| Jul | 23.88 | 25.26 | 1.39 |
| Aug | 24.59 | 25.29 | 0.70 |
| Sep | 22.29 | 22.54 | 0.26 |
| Oct | 18.11 | 19.31 | 1.20 |
| Nov | 13.87 | 15.18 | 1.31 |
| Dec | 10.39 | 12.38 | 1.99 |
| ⌀ Month | 16.41 | 17.37 | 0.97 |
Sunshine (h)
| Month | ⌀ 1940 - 1950 | ⌀ 2013 - 2023 | +/- |
|---|---|---|---|
| Jan | 6.67 | 6.79 | 0.12 |
| Feb | 7.92 | 7.96 | 0.04 |
| Mar | 9.72 | 9.27 | -0.45 |
| Apr | 11.18 | 10.70 | -0.49 |
| May | 12.03 | 11.71 | -0.31 |
| Jun | 13.33 | 12.90 | -0.43 |
| Jul | 13.34 | 13.19 | -0.16 |
| Aug | 12.62 | 12.43 | -0.20 |
| Sep | 10.90 | 10.45 | -0.45 |
| Oct | 8.90 | 8.79 | -0.11 |
| Nov | 7.31 | 6.81 | -0.50 |
| Dec | 6.44 | 6.47 | 0.03 |
| ⌀ Month | 10.03 | 9.79 | -0.24 |
Rain (mm)
| Month | ⌀ 1940 - 1950 | ⌀ 2013 - 2023 | +/- |
|---|---|---|---|
| Jan | 2.96 | 3.24 | 0.29 |
| Feb | 3.03 | 3.05 | 0.02 |
| Mar | 1.95 | 2.63 | 0.68 |
| Apr | 1.81 | 1.97 | 0.16 |
| May | 1.39 | 1.93 | 0.54 |
| Jun | 0.83 | 1.01 | 0.17 |
| Jul | 0.29 | 0.36 | 0.07 |
| Aug | 0.41 | 0.47 | 0.06 |
| Sep | 1.18 | 1.68 | 0.51 |
| Oct | 2.96 | 2.56 | -0.40 |
| Nov | 4.21 | 4.63 | 0.42 |
| Dec | 3.80 | 3.60 | -0.21 |
| ⌀ Month | 2.07 | 2.26 | 0.19 |
Snow (mm)
| Month | ⌀ 1940 - 1950 | ⌀ 2013 - 2023 | +/- |
|---|---|---|---|
| Jan | 0.20 | 0.03 | -0.17 |
| Feb | 0.11 | 0.10 | -0.01 |
| Mar | 0.05 | 0.03 | -0.02 |
| Apr | 0.01 | 0.00 | -0.01 |
| May | 0.00 | 0.00 | 0.00 |
| Jun | 0.00 | 0.00 | 0.00 |
| Jul | 0.00 | 0.00 | 0.00 |
| Aug | 0.00 | 0.00 | 0.00 |
| Sep | 0.00 | 0.00 | 0.00 |
| Oct | 0.00 | 0.00 | -0.00 |
| Nov | 0.01 | 0.00 | -0.01 |
| Dec | 0.18 | 0.00 | -0.18 |
| ⌀ Month | 0.05 | 0.01 | -0.03 |