Climate Change Chart of Copper Mountain, USA
Comprehensive Climate Change Chart of Copper Mountain, USA: Monthly Averages and Impact Trends
Explore the changing climate in Copper Mountain, USA, through data analysis and insights.
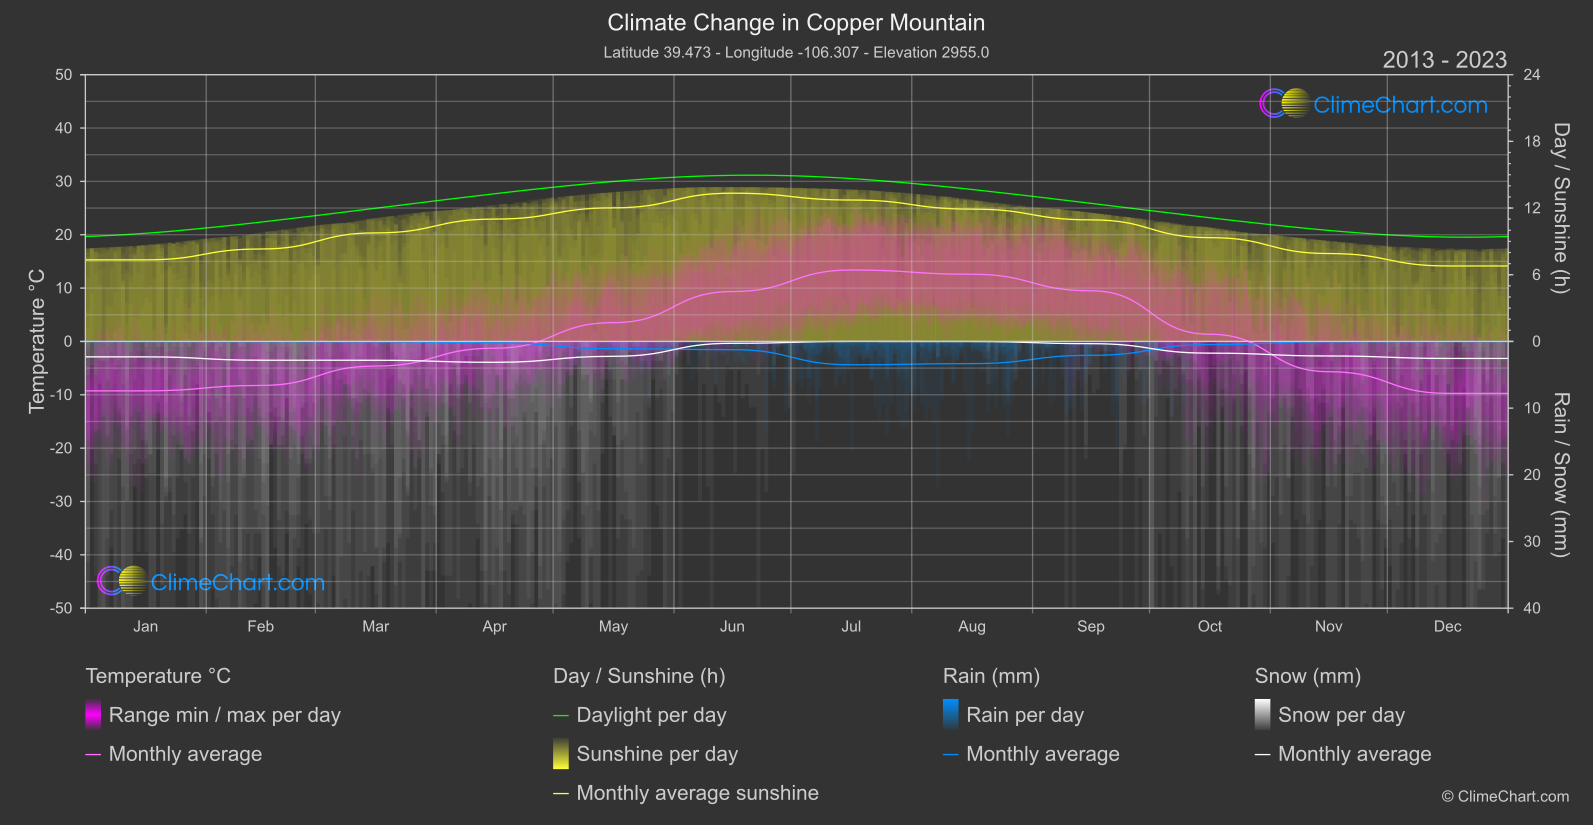
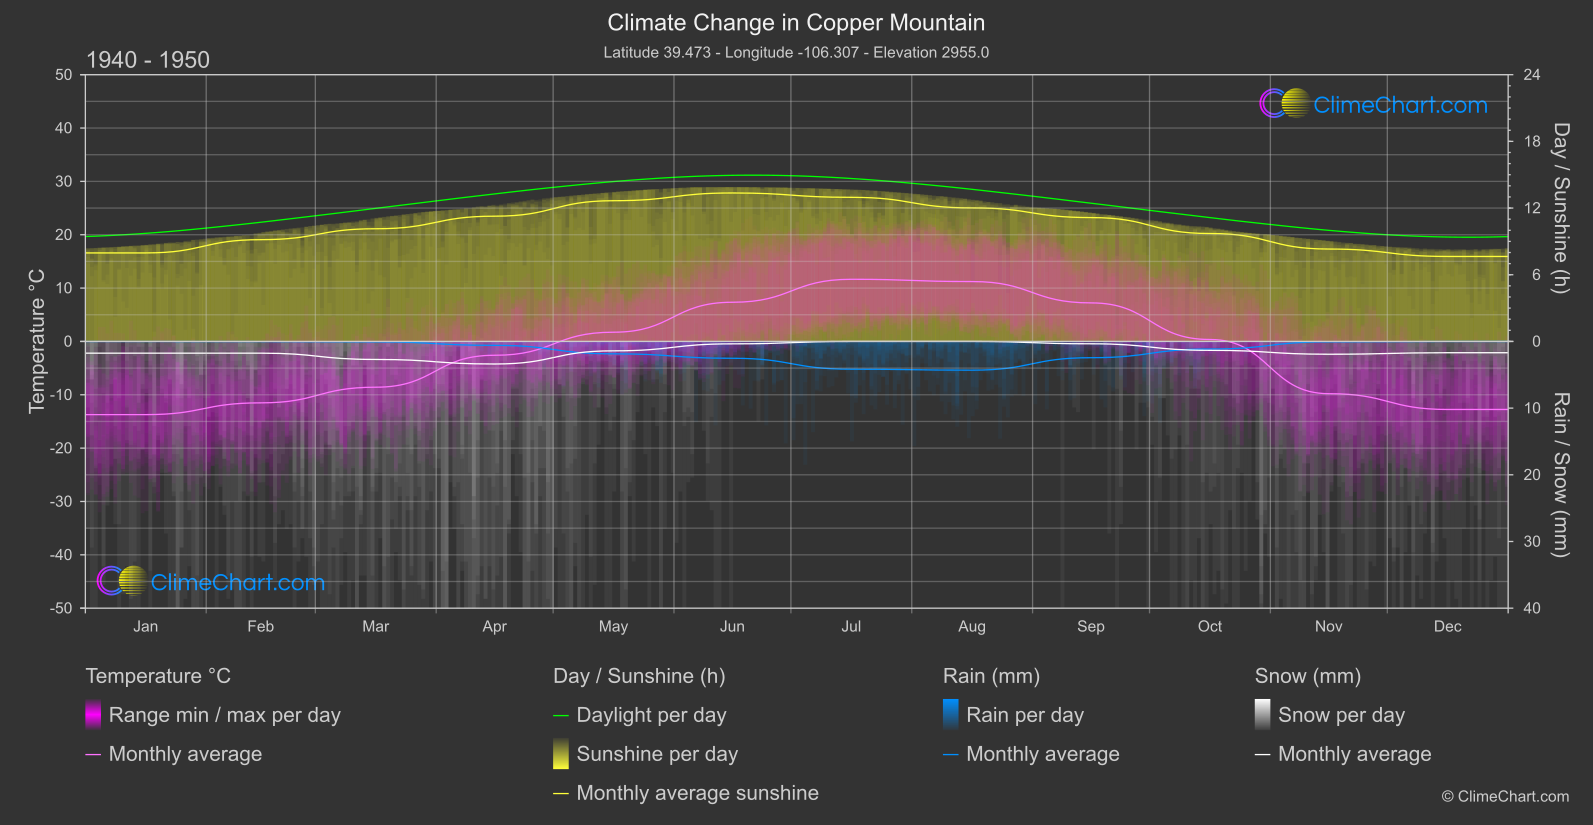
Copper Mountain in the USA has experienced notable shifts in temperature, rainfall, snowfall, and sunshine duration over the years. From January to December, various months have shown significant changes in climate variables. For instance, November exhibited the highest temperature change of 4.12°C, while April had the highest rainfall decrease of 0.20mm. These insights provide a glimpse into the evolving climate patterns in Copper Mountain.
Climate Change Data Overview for Copper Mountain, USA
Explore the comprehensive climate change data for Copper Mountain, USA. This detailed table provides valuable insights into temperature variations, precipitation levels, and seasonal changes influenced by climate change, helping you understand the unique weather patterns of this region.
Temperature °C
| Month | ⌀ 1940 - 1950 | ⌀ 2013 - 2023 | +/- |
|---|---|---|---|
| Jan | -13.72 | -9.27 | 4.46 |
| Feb | -11.51 | -8.25 | 3.27 |
| Mar | -8.58 | -4.61 | 3.97 |
| Apr | -2.59 | -1.27 | 1.33 |
| May | 1.73 | 3.53 | 1.80 |
| Jun | 7.34 | 9.35 | 2.00 |
| Jul | 11.65 | 13.39 | 1.74 |
| Aug | 11.22 | 12.59 | 1.37 |
| Sep | 7.22 | 9.50 | 2.27 |
| Oct | 0.36 | 1.35 | 0.98 |
| Nov | -9.79 | -5.68 | 4.12 |
| Dec | -12.76 | -9.73 | 3.02 |
| ⌀ Month | -1.62 | 0.91 | 2.53 |
Sunshine (h)
| Month | ⌀ 1940 - 1950 | ⌀ 2013 - 2023 | +/- |
|---|---|---|---|
| Jan | 7.96 | 7.34 | -0.62 |
| Feb | 9.16 | 8.32 | -0.84 |
| Mar | 10.14 | 9.77 | -0.37 |
| Apr | 11.27 | 11.01 | -0.26 |
| May | 12.66 | 12.02 | -0.64 |
| Jun | 13.36 | 13.34 | -0.02 |
| Jul | 12.97 | 12.72 | -0.24 |
| Aug | 12.01 | 11.91 | -0.11 |
| Sep | 11.14 | 10.94 | -0.21 |
| Oct | 9.71 | 9.34 | -0.37 |
| Nov | 8.31 | 7.91 | -0.40 |
| Dec | 7.65 | 6.79 | -0.85 |
| ⌀ Month | 10.53 | 10.12 | -0.41 |
Rain (mm)
| Month | ⌀ 1940 - 1950 | ⌀ 2013 - 2023 | +/- |
|---|---|---|---|
| Jan | 0.01 | 0.01 | 0.00 |
| Feb | 0.01 | 0.02 | 0.01 |
| Mar | 0.03 | 0.03 | -0.00 |
| Apr | 0.29 | 0.10 | -0.20 |
| May | 0.93 | 0.54 | -0.39 |
| Jun | 1.26 | 0.62 | -0.65 |
| Jul | 2.08 | 1.75 | -0.33 |
| Aug | 2.15 | 1.66 | -0.49 |
| Sep | 1.22 | 1.04 | -0.18 |
| Oct | 0.57 | 0.24 | -0.33 |
| Nov | 0.03 | 0.02 | -0.01 |
| Dec | 0.00 | 0.01 | 0.00 |
| ⌀ Month | 0.72 | 0.50 | -0.21 |
Snow (mm)
| Month | ⌀ 1940 - 1950 | ⌀ 2013 - 2023 | +/- |
|---|---|---|---|
| Jan | 0.88 | 1.16 | 0.28 |
| Feb | 0.88 | 1.41 | 0.53 |
| Mar | 1.35 | 1.41 | 0.06 |
| Apr | 1.69 | 1.57 | -0.13 |
| May | 0.70 | 1.12 | 0.41 |
| Jun | 0.18 | 0.14 | -0.04 |
| Jul | 0.00 | 0.00 | 0.00 |
| Aug | 0.00 | 0.01 | 0.01 |
| Sep | 0.18 | 0.17 | -0.01 |
| Oct | 0.67 | 0.88 | 0.21 |
| Nov | 0.96 | 1.09 | 0.13 |
| Dec | 0.85 | 1.27 | 0.43 |
| ⌀ Month | 0.69 | 0.85 | 0.16 |