Climate Change Chart of Copenhagen, Denmark
Comprehensive Climate Change Chart of Copenhagen, Denmark: Monthly Averages and Impact Trends
Exploring the changing climate in Copenhagen, Denmark
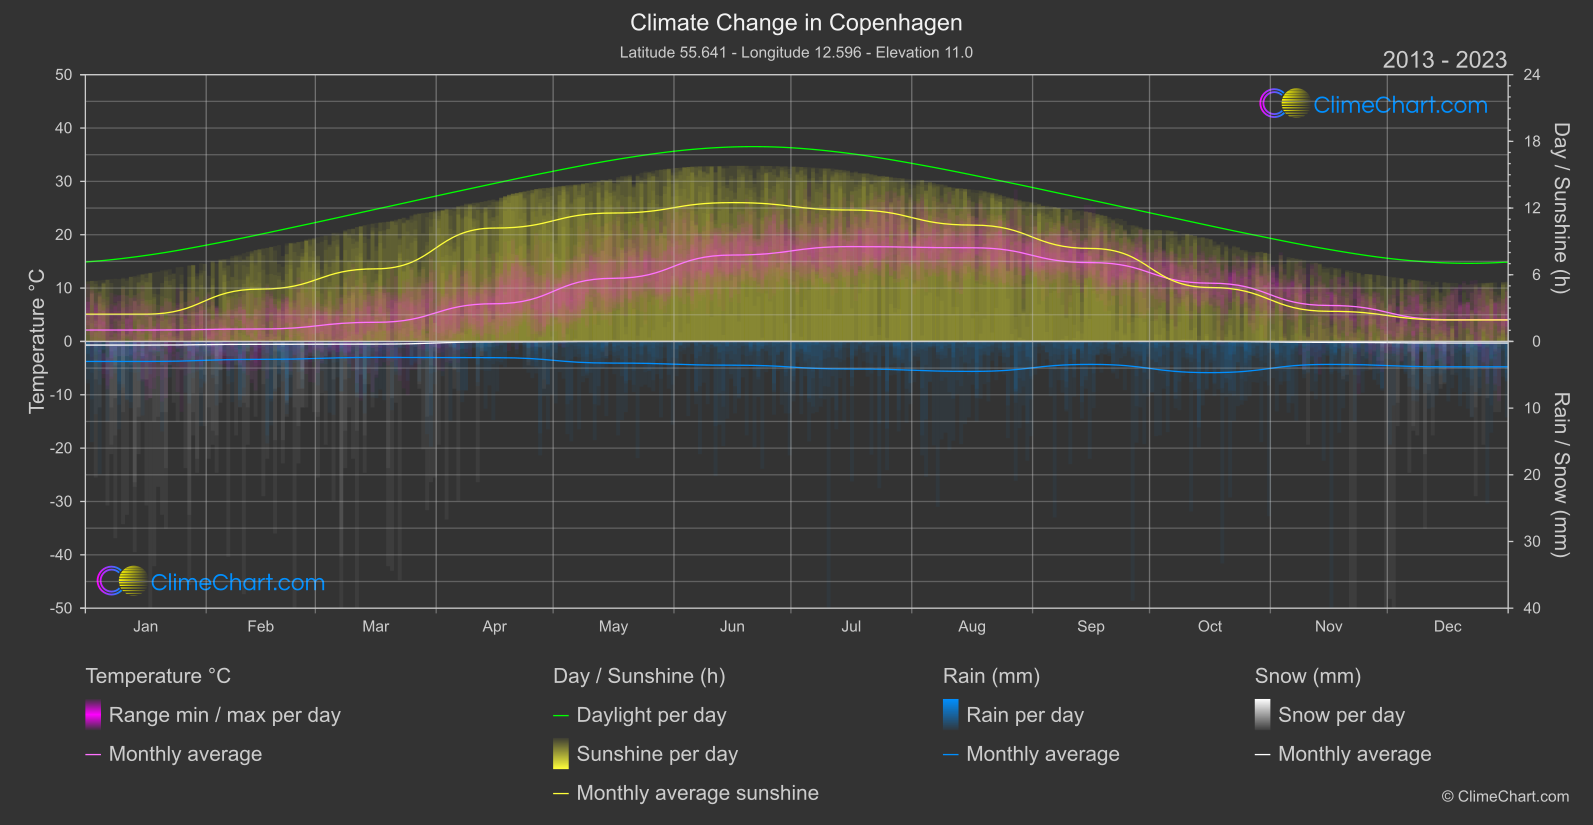
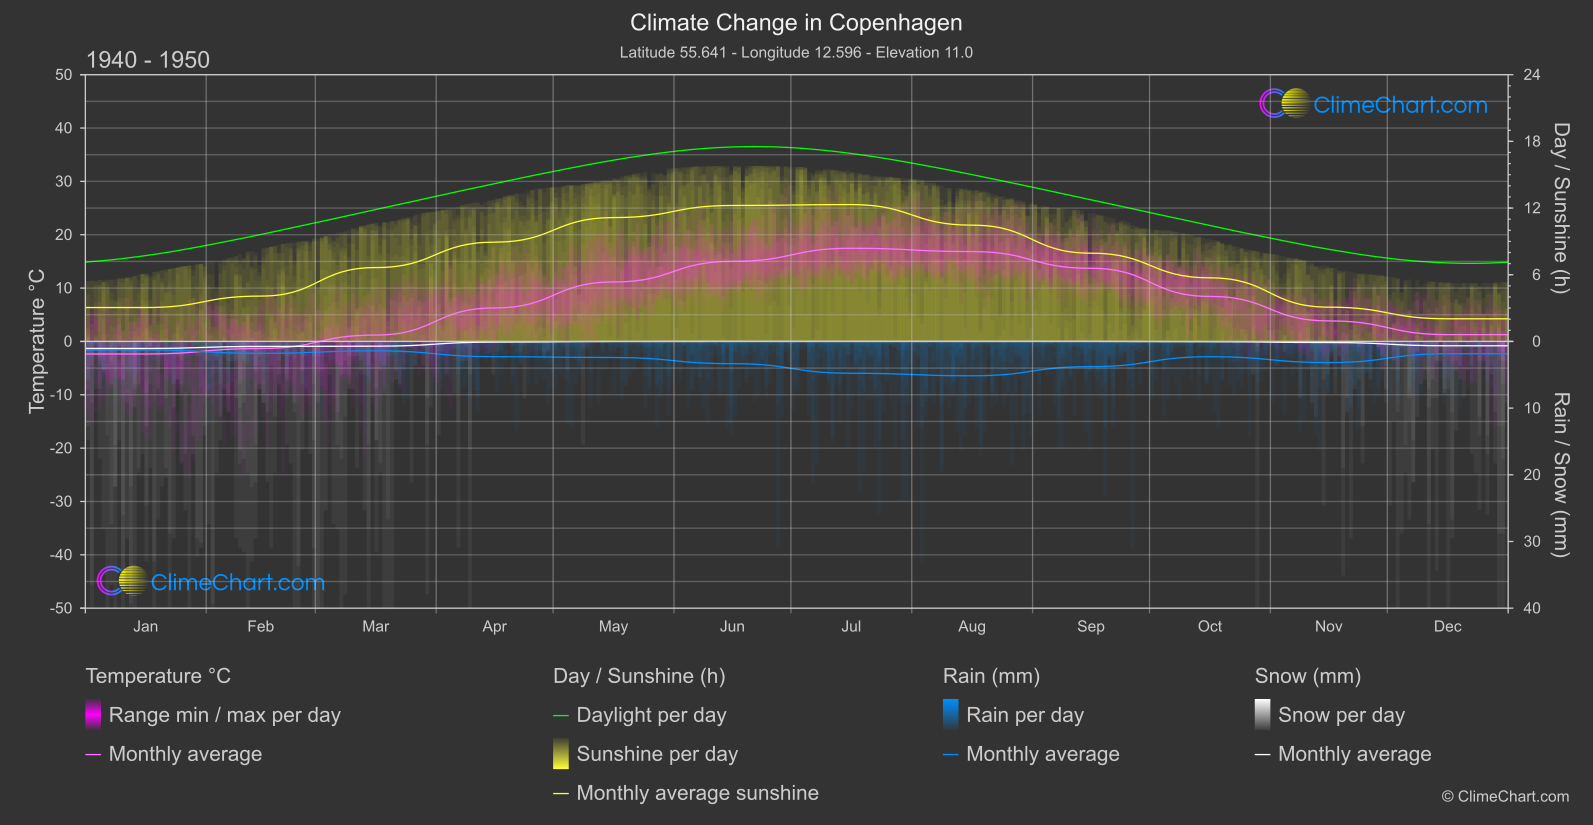
Copenhagen, the capital of Denmark, has experienced noticeable changes in its climate over the years. From temperature variations to shifts in rainfall patterns and sunshine duration, the data reveals intriguing insights. For instance, analyzing the data shows that October has seen a significant increase in temperature, while December has experienced a notable rise in rainfall. Understanding these climate trends is crucial for adapting to the changing environment.
Climate Change Data Overview for Copenhagen, Denmark
Explore the comprehensive climate change data for Copenhagen, Denmark. This detailed table provides valuable insights into temperature variations, precipitation levels, and seasonal changes influenced by climate change, helping you understand the unique weather patterns of this region.
Temperature °C
| Month | ⌀ 1940 - 1950 | ⌀ 2013 - 2023 | +/- |
|---|---|---|---|
| Jan | -2.36 | 2.13 | 4.49 |
| Feb | -1.32 | 2.33 | 3.66 |
| Mar | 1.20 | 3.58 | 2.39 |
| Apr | 6.28 | 7.07 | 0.79 |
| May | 11.14 | 11.83 | 0.69 |
| Jun | 15.01 | 16.19 | 1.18 |
| Jul | 17.46 | 17.78 | 0.31 |
| Aug | 16.84 | 17.56 | 0.71 |
| Sep | 13.71 | 14.78 | 1.07 |
| Oct | 8.44 | 10.92 | 2.48 |
| Nov | 3.84 | 6.74 | 2.90 |
| Dec | 1.27 | 4.08 | 2.81 |
| ⌀ Month | 7.63 | 9.58 | 1.96 |
Sunshine (h)
| Month | ⌀ 1940 - 1950 | ⌀ 2013 - 2023 | +/- |
|---|---|---|---|
| Jan | 3.05 | 2.45 | -0.60 |
| Feb | 4.08 | 4.71 | 0.63 |
| Mar | 6.65 | 6.53 | -0.12 |
| Apr | 8.93 | 10.20 | 1.27 |
| May | 11.14 | 11.55 | 0.41 |
| Jun | 12.23 | 12.49 | 0.26 |
| Jul | 12.31 | 11.83 | -0.49 |
| Aug | 10.46 | 10.47 | 0.01 |
| Sep | 7.94 | 8.37 | 0.43 |
| Oct | 5.72 | 4.85 | -0.87 |
| Nov | 3.08 | 2.71 | -0.37 |
| Dec | 2.04 | 1.93 | -0.11 |
| ⌀ Month | 7.30 | 7.34 | 0.04 |
Rain (mm)
| Month | ⌀ 1940 - 1950 | ⌀ 2013 - 2023 | +/- |
|---|---|---|---|
| Jan | 0.64 | 1.50 | 0.86 |
| Feb | 0.89 | 1.34 | 0.45 |
| Mar | 0.70 | 1.20 | 0.50 |
| Apr | 1.14 | 1.22 | 0.07 |
| May | 1.20 | 1.62 | 0.42 |
| Jun | 1.67 | 1.78 | 0.11 |
| Jul | 2.39 | 2.07 | -0.32 |
| Aug | 2.58 | 2.25 | -0.33 |
| Sep | 1.89 | 1.72 | -0.17 |
| Oct | 1.14 | 2.34 | 1.20 |
| Nov | 1.58 | 1.72 | 0.14 |
| Dec | 0.92 | 1.90 | 0.98 |
| ⌀ Month | 1.40 | 1.72 | 0.33 |
Snow (mm)
| Month | ⌀ 1940 - 1950 | ⌀ 2013 - 2023 | +/- |
|---|---|---|---|
| Jan | 0.53 | 0.27 | -0.25 |
| Feb | 0.37 | 0.22 | -0.16 |
| Mar | 0.36 | 0.20 | -0.15 |
| Apr | 0.05 | 0.04 | -0.01 |
| May | 0.01 | 0.00 | -0.01 |
| Jun | 0.00 | 0.00 | 0.00 |
| Jul | 0.00 | 0.00 | 0.00 |
| Aug | 0.00 | 0.00 | 0.00 |
| Sep | 0.00 | 0.00 | 0.00 |
| Oct | 0.02 | 0.00 | -0.02 |
| Nov | 0.08 | 0.07 | -0.01 |
| Dec | 0.32 | 0.12 | -0.21 |
| ⌀ Month | 0.14 | 0.08 | -0.07 |