Climate Change Chart of Cologne, Germany
Comprehensive Climate Change Chart of Cologne, Germany: Monthly Averages and Impact Trends
Exploring the climate change data for Cologne, Germany reveals intriguing insights into the changing weather patterns. Discover how temperatures, rainfall, snowfall, and sunshine duration have evolved over the years.
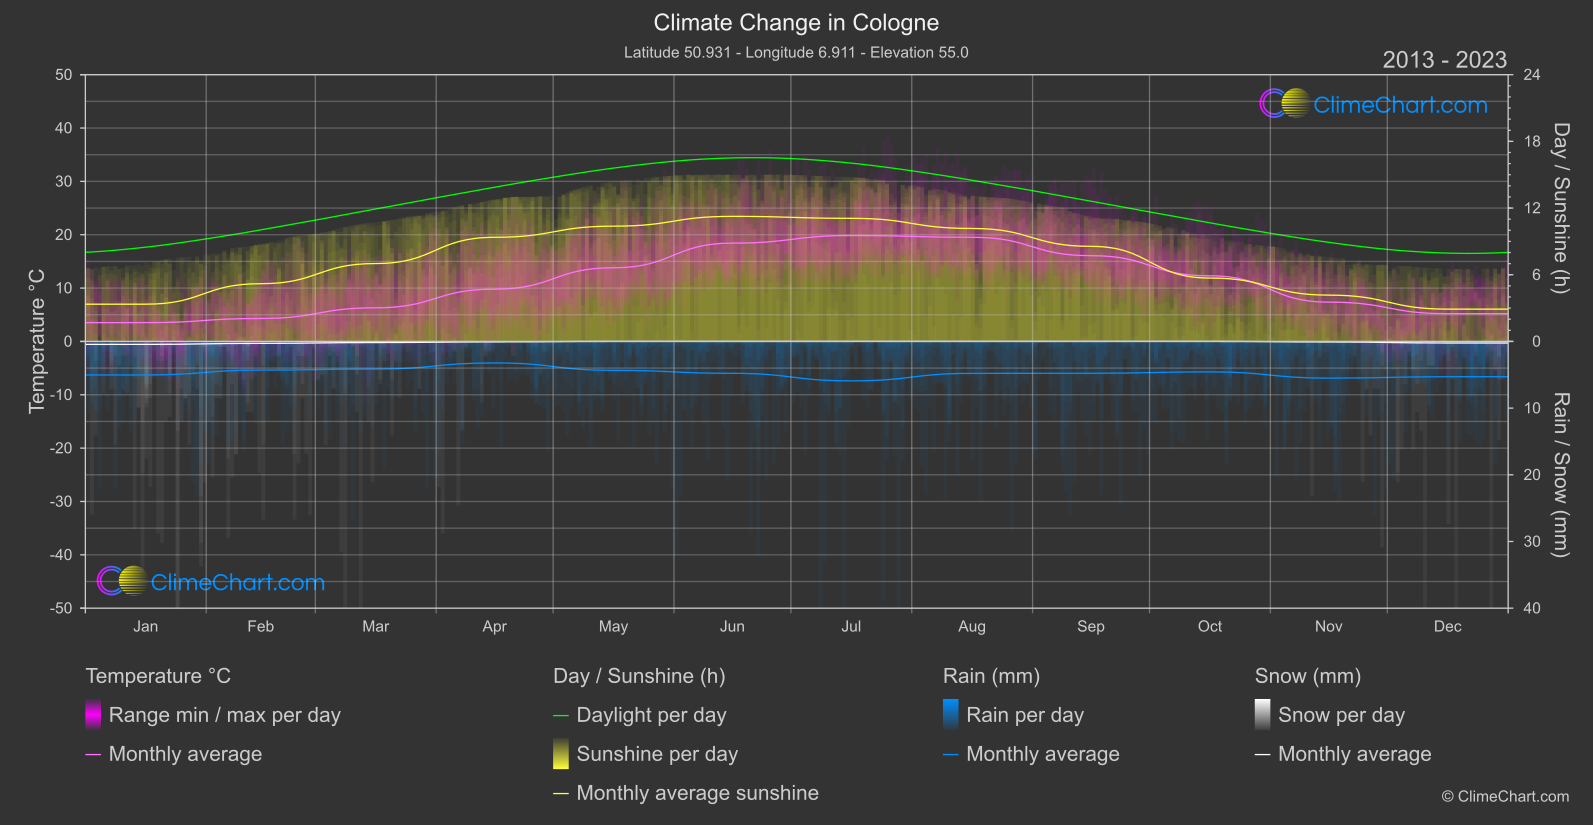
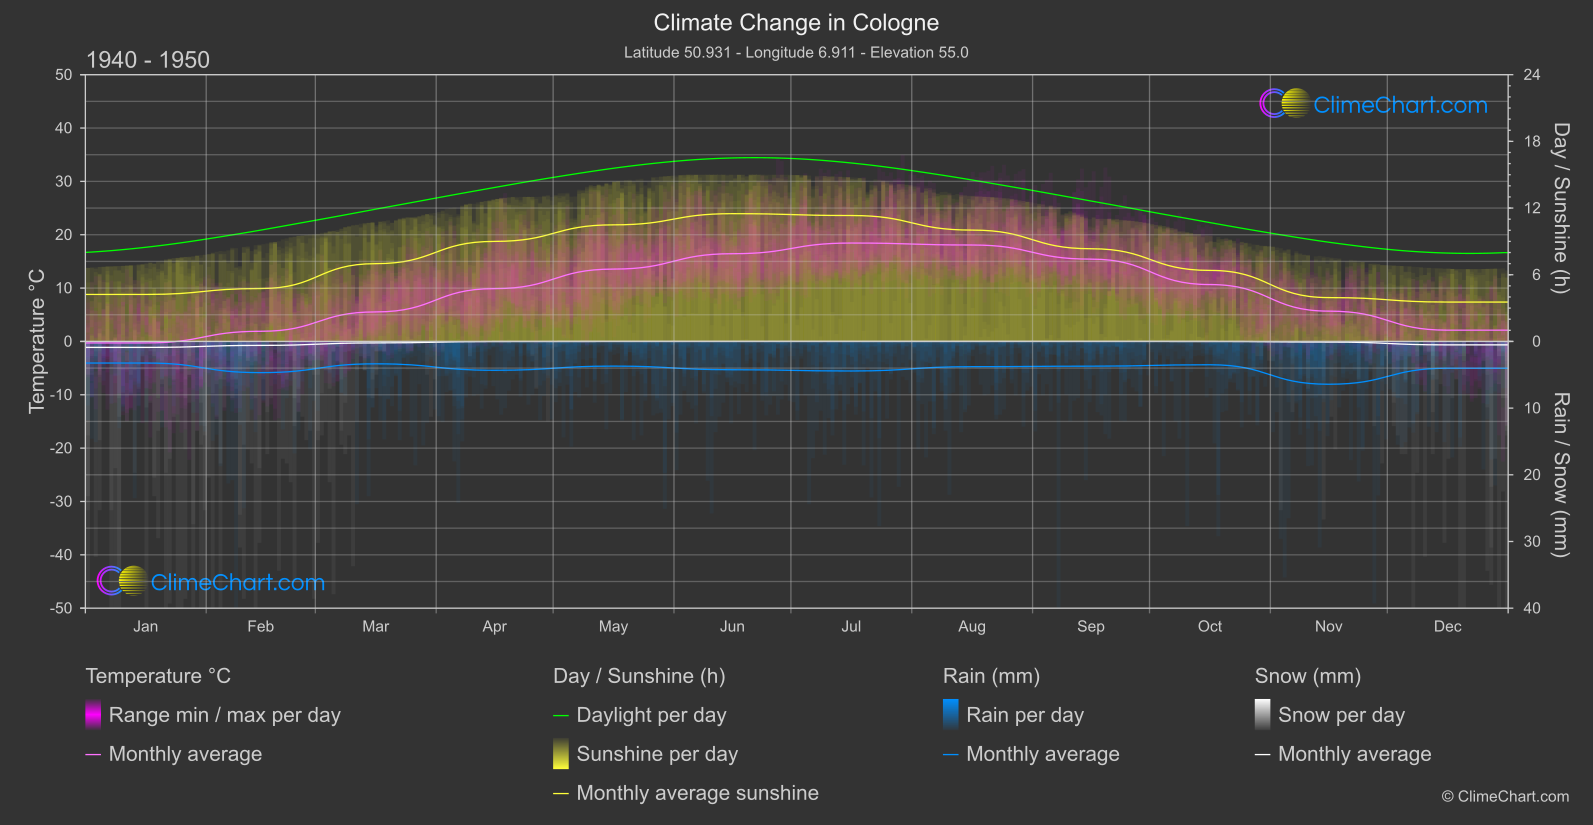
Cologne, Germany, has experienced notable changes in its climate over the years. Analyzing the temperature data from 1940 to 1950 compared to 2013 to 2024 shows an overall increase in temperatures across most months. The month of December stands out with a significant temperature change of 3.09°C, indicating a warming trend. When it comes to rainfall, the data illustrates varying patterns, with some months experiencing an increase in rainfall while others show a decrease. The month of July saw the highest increase in rainfall at 0.74mm. Snowfall in Cologne has significantly decreased over the years, with notable declines in January and December. Additionally, the sunshine duration has shown fluctuations, with some months experiencing a decrease in sunshine hours. November witnessed the highest increase in sunshine duration at 0.22 hours. These insights highlight the dynamic nature of climate change in Cologne, emphasizing the need for continued monitoring and sustainable practices.
Climate Change Data Overview for Cologne, Germany
Explore the comprehensive climate change data for Cologne, Germany. This detailed table provides valuable insights into temperature variations, precipitation levels, and seasonal changes influenced by climate change, helping you understand the unique weather patterns of this region.
Temperature °C
| Month | ⌀ 1940 - 1950 | ⌀ 2013 - 2023 | +/- |
|---|---|---|---|
| Jan | -0.28 | 3.52 | 3.80 |
| Feb | 1.90 | 4.30 | 2.40 |
| Mar | 5.53 | 6.30 | 0.77 |
| Apr | 9.90 | 9.80 | -0.09 |
| May | 13.56 | 13.81 | 0.25 |
| Jun | 16.44 | 18.43 | 1.99 |
| Jul | 18.44 | 19.85 | 1.40 |
| Aug | 18.07 | 19.52 | 1.45 |
| Sep | 15.43 | 16.07 | 0.65 |
| Oct | 10.66 | 12.30 | 1.64 |
| Nov | 5.68 | 7.37 | 1.69 |
| Dec | 2.11 | 5.20 | 3.09 |
| ⌀ Month | 9.79 | 11.37 | 1.59 |
Sunshine (h)
| Month | ⌀ 1940 - 1950 | ⌀ 2013 - 2023 | +/- |
|---|---|---|---|
| Jan | 4.23 | 3.35 | -0.88 |
| Feb | 4.76 | 5.19 | 0.43 |
| Mar | 7.00 | 7.01 | 0.01 |
| Apr | 9.00 | 9.37 | 0.37 |
| May | 10.49 | 10.37 | -0.12 |
| Jun | 11.50 | 11.25 | -0.24 |
| Jul | 11.33 | 11.08 | -0.25 |
| Aug | 10.02 | 10.16 | 0.15 |
| Sep | 8.34 | 8.55 | 0.22 |
| Oct | 6.39 | 5.70 | -0.69 |
| Nov | 3.94 | 4.17 | 0.22 |
| Dec | 3.54 | 2.91 | -0.64 |
| ⌀ Month | 7.54 | 7.43 | -0.12 |
Rain (mm)
| Month | ⌀ 1940 - 1950 | ⌀ 2013 - 2023 | +/- |
|---|---|---|---|
| Jan | 1.62 | 2.51 | 0.90 |
| Feb | 2.34 | 2.15 | -0.19 |
| Mar | 1.68 | 2.07 | 0.39 |
| Apr | 2.16 | 1.61 | -0.55 |
| May | 1.85 | 2.17 | 0.32 |
| Jun | 2.12 | 2.39 | 0.27 |
| Jul | 2.22 | 2.96 | 0.74 |
| Aug | 1.89 | 2.39 | 0.50 |
| Sep | 1.85 | 2.39 | 0.53 |
| Oct | 1.75 | 2.28 | 0.53 |
| Nov | 3.21 | 2.75 | -0.46 |
| Dec | 2.01 | 2.65 | 0.64 |
| ⌀ Month | 2.06 | 2.36 | 0.30 |
Snow (mm)
| Month | ⌀ 1940 - 1950 | ⌀ 2013 - 2023 | +/- |
|---|---|---|---|
| Jan | 0.45 | 0.22 | -0.23 |
| Feb | 0.30 | 0.14 | -0.15 |
| Mar | 0.11 | 0.08 | -0.03 |
| Apr | 0.01 | 0.03 | 0.03 |
| May | 0.00 | 0.00 | 0.00 |
| Jun | 0.00 | 0.00 | 0.00 |
| Jul | 0.00 | 0.00 | 0.00 |
| Aug | 0.00 | 0.00 | 0.00 |
| Sep | 0.00 | 0.00 | 0.00 |
| Oct | 0.00 | 0.00 | -0.00 |
| Nov | 0.05 | 0.04 | -0.01 |
| Dec | 0.26 | 0.12 | -0.14 |
| ⌀ Month | 0.10 | 0.05 | -0.04 |