Climate Change Chart of Chicago, USA
Comprehensive Climate Change Chart of Chicago, USA: Monthly Averages and Impact Trends
Exploring the changing climate in Chicago, USA
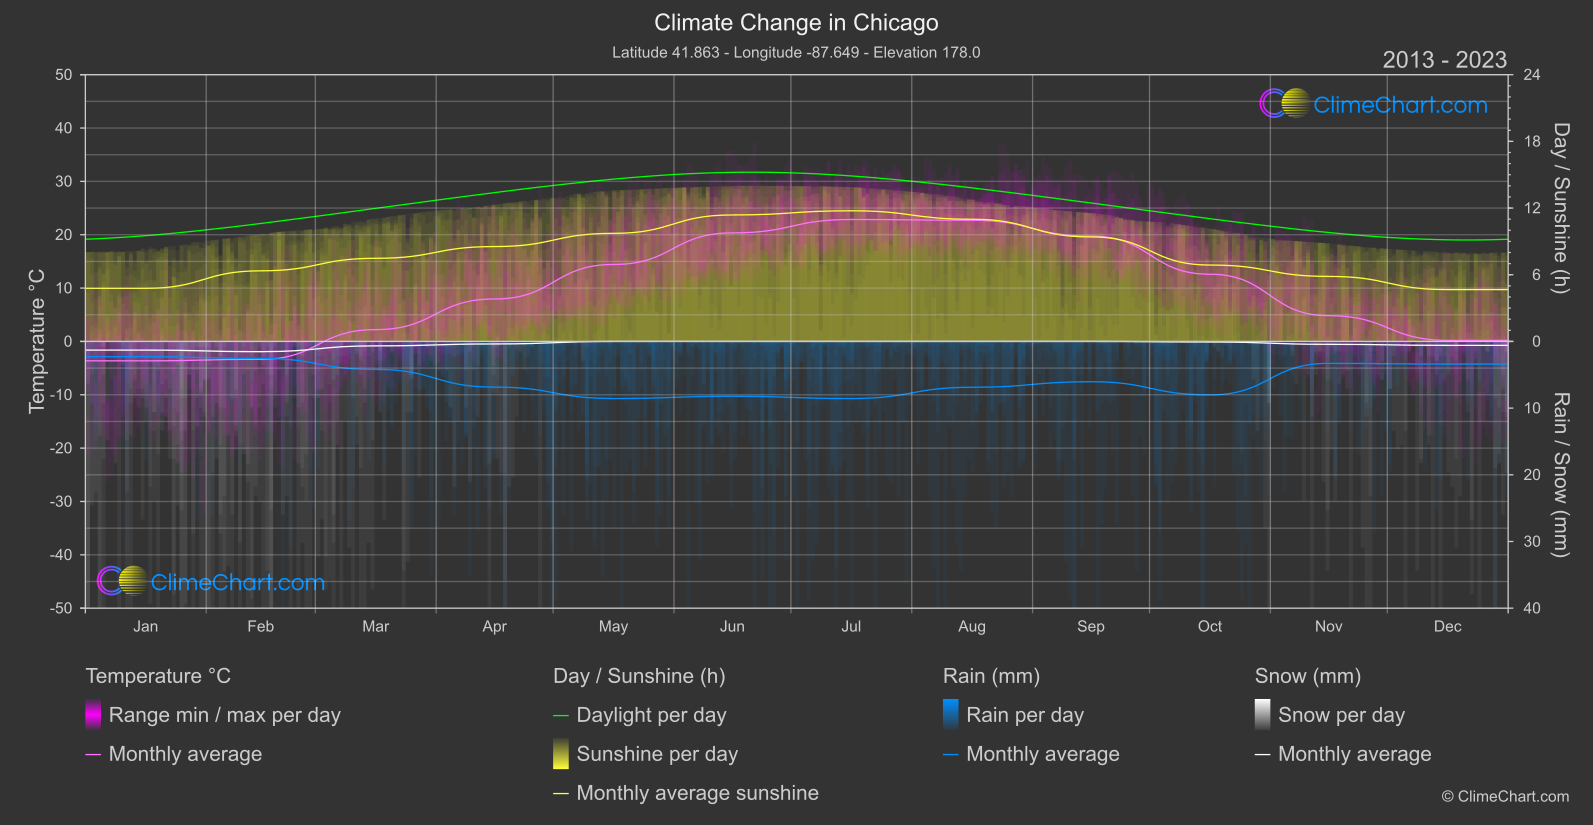
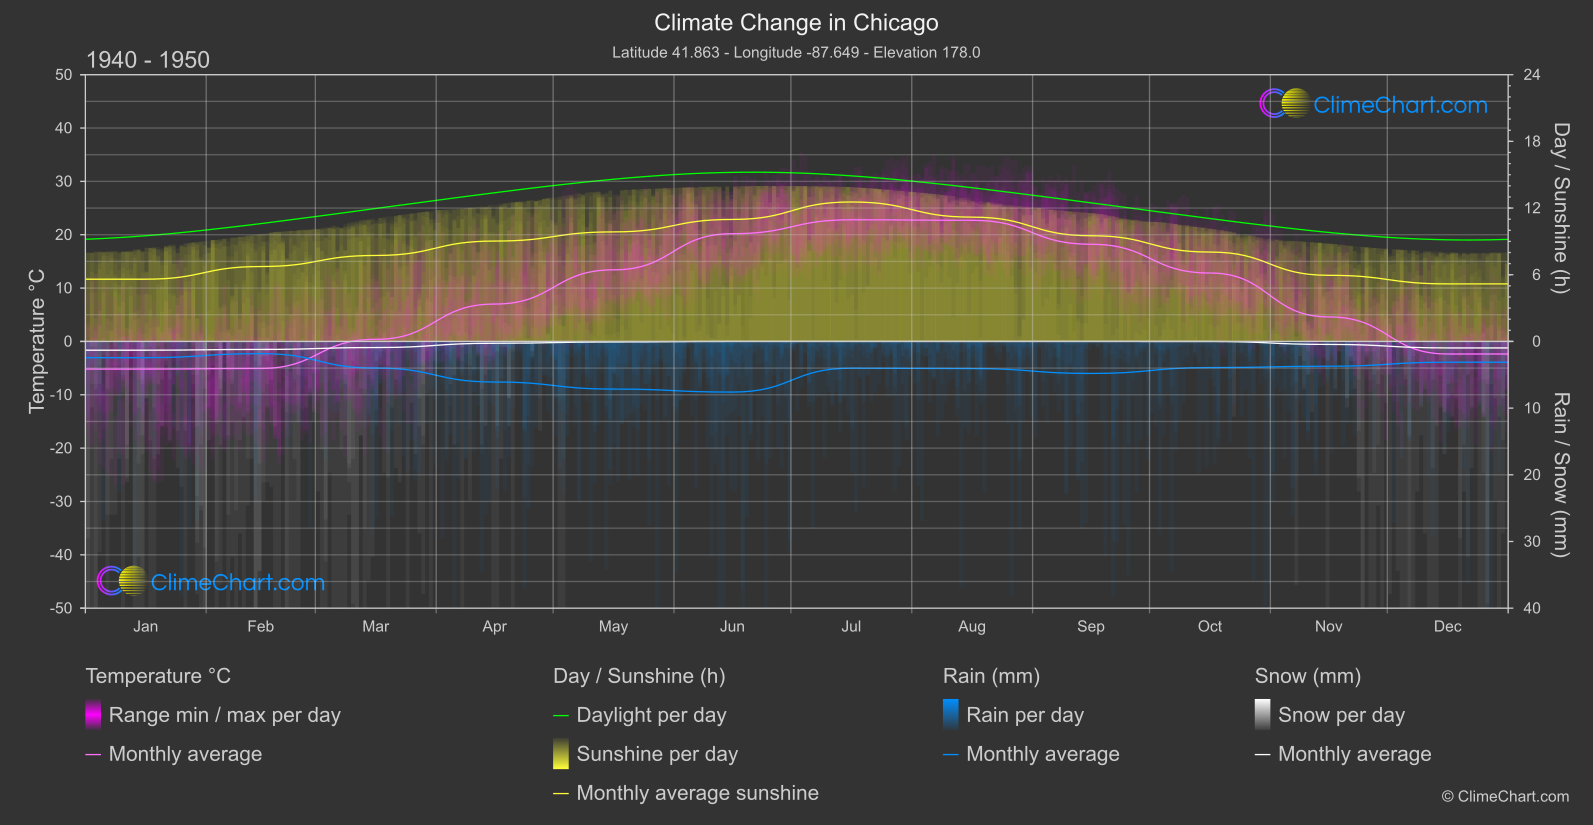
Chicago, known for its unpredictable weather, has experienced notable shifts in temperature, rainfall, snowfall, and sunshine duration over the years. Analyzing data from the 1940s to the present decade, we observe interesting trends. For instance, September shows a significant temperature increase of 1.54°C, while July experiences a remarkable rise in rainfall of 2.28mm. In terms of snowfall, October witnesses a substantial increase of 0.04mm. Additionally, the sunshine duration in June saw a rise of 0.40 hours.
Climate Change Data Overview for Chicago, USA
Explore the comprehensive climate change data for Chicago, USA. This detailed table provides valuable insights into temperature variations, precipitation levels, and seasonal changes influenced by climate change, helping you understand the unique weather patterns of this region.
Temperature °C
| Month | ⌀ 1940 - 1950 | ⌀ 2013 - 2023 | +/- |
|---|---|---|---|
| Jan | -5.18 | -3.64 | 1.54 |
| Feb | -5.06 | -3.35 | 1.71 |
| Mar | 0.40 | 2.22 | 1.82 |
| Apr | 7.01 | 7.96 | 0.95 |
| May | 13.42 | 14.43 | 1.01 |
| Jun | 20.20 | 20.35 | 0.15 |
| Jul | 22.80 | 22.86 | 0.05 |
| Aug | 22.70 | 22.71 | 0.01 |
| Sep | 18.21 | 19.75 | 1.54 |
| Oct | 12.82 | 12.59 | -0.23 |
| Nov | 4.59 | 4.82 | 0.23 |
| Dec | -2.35 | 0.19 | 2.55 |
| ⌀ Month | 9.13 | 10.07 | 0.95 |
Sunshine (h)
| Month | ⌀ 1940 - 1950 | ⌀ 2013 - 2023 | +/- |
|---|---|---|---|
| Jan | 5.60 | 4.78 | -0.82 |
| Feb | 6.74 | 6.35 | -0.39 |
| Mar | 7.74 | 7.48 | -0.26 |
| Apr | 9.03 | 8.54 | -0.49 |
| May | 9.86 | 9.72 | -0.13 |
| Jun | 10.98 | 11.38 | 0.40 |
| Jul | 12.55 | 11.75 | -0.79 |
| Aug | 11.18 | 10.99 | -0.19 |
| Sep | 9.51 | 9.40 | -0.11 |
| Oct | 8.04 | 6.87 | -1.17 |
| Nov | 5.95 | 5.85 | -0.10 |
| Dec | 5.18 | 4.66 | -0.51 |
| ⌀ Month | 8.53 | 8.15 | -0.38 |
Rain (mm)
| Month | ⌀ 1940 - 1950 | ⌀ 2013 - 2023 | +/- |
|---|---|---|---|
| Jan | 1.22 | 1.15 | -0.07 |
| Feb | 0.91 | 1.27 | 0.36 |
| Mar | 2.00 | 2.10 | 0.10 |
| Apr | 3.04 | 3.43 | 0.38 |
| May | 3.57 | 4.28 | 0.71 |
| Jun | 3.80 | 4.11 | 0.32 |
| Jul | 2.01 | 4.28 | 2.28 |
| Aug | 2.03 | 3.44 | 1.40 |
| Sep | 2.40 | 3.02 | 0.62 |
| Oct | 1.96 | 4.00 | 2.04 |
| Nov | 1.86 | 1.64 | -0.22 |
| Dec | 1.56 | 1.70 | 0.14 |
| ⌀ Month | 2.20 | 2.87 | 0.67 |
Snow (mm)
| Month | ⌀ 1940 - 1950 | ⌀ 2013 - 2023 | +/- |
|---|---|---|---|
| Jan | 0.66 | 0.65 | -0.01 |
| Feb | 0.60 | 0.77 | 0.17 |
| Mar | 0.46 | 0.33 | -0.13 |
| Apr | 0.14 | 0.19 | 0.05 |
| May | 0.04 | 0.00 | -0.04 |
| Jun | 0.00 | 0.00 | 0.00 |
| Jul | 0.00 | 0.00 | 0.00 |
| Aug | 0.00 | 0.00 | 0.00 |
| Sep | 0.00 | 0.00 | 0.00 |
| Oct | 0.00 | 0.04 | 0.04 |
| Nov | 0.22 | 0.22 | -0.01 |
| Dec | 0.49 | 0.29 | -0.19 |
| ⌀ Month | 0.22 | 0.21 | -0.01 |