Climate Change Chart of Chengdu, China
Comprehensive Climate Change Chart of Chengdu, China: Monthly Averages and Impact Trends
Exploring the changing climate in Chengdu, China reveals intriguing insights into temperature, rainfall, snowfall, and sunshine duration over the years.
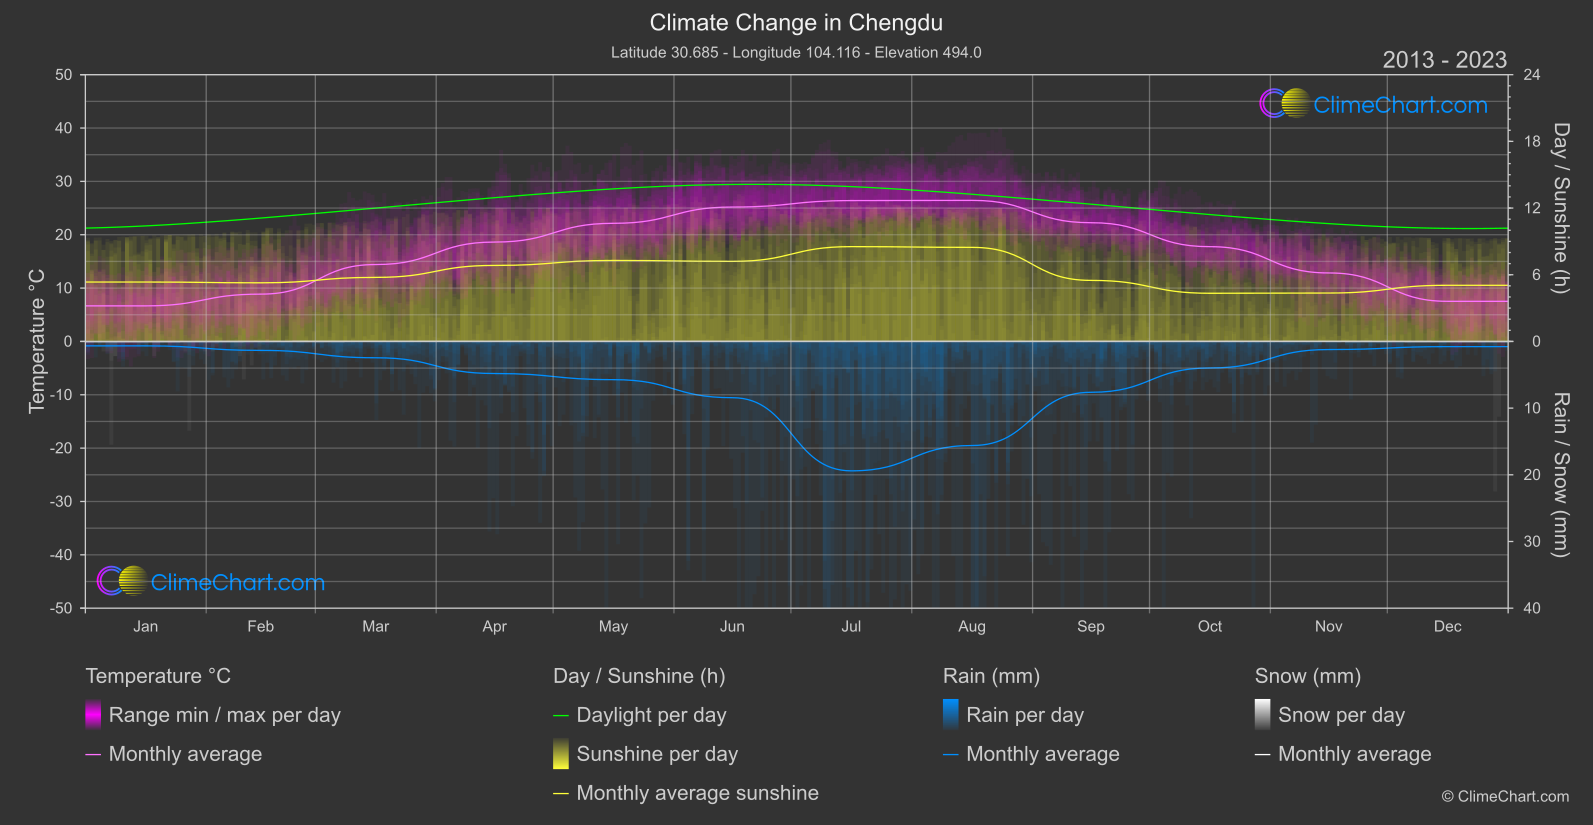
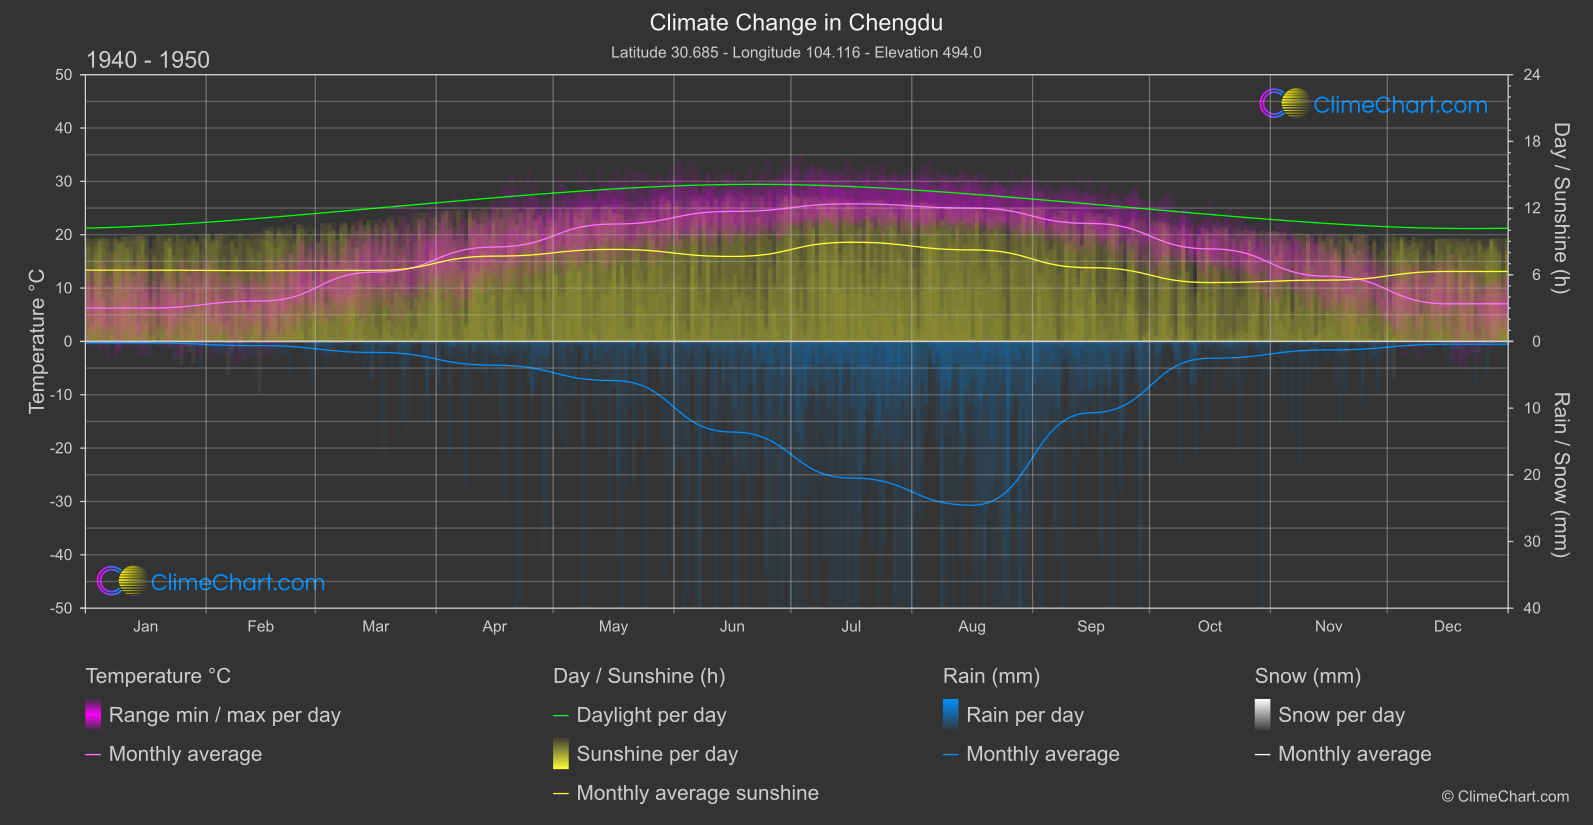
Chengdu, known for its rich cultural heritage, is also experiencing notable climate changes. The data shows that August has seen the most significant temperature increase over the years, while June has experienced the highest decrease in rainfall. Snowfall remains minimal throughout the recorded years, with December showing the most noticeable change. The sunshine duration has fluctuated, with December having the most substantial decrease in sunlight hours.
Climate Change Data Overview for Chengdu, China
Explore the comprehensive climate change data for Chengdu, China. This detailed table provides valuable insights into temperature variations, precipitation levels, and seasonal changes influenced by climate change, helping you understand the unique weather patterns of this region.
Temperature °C
| Month | ⌀ 1940 - 1950 | ⌀ 2013 - 2023 | +/- |
|---|---|---|---|
| Jan | 6.25 | 6.67 | 0.42 |
| Feb | 7.57 | 8.87 | 1.30 |
| Mar | 12.99 | 14.41 | 1.42 |
| Apr | 17.70 | 18.63 | 0.93 |
| May | 22.00 | 22.14 | 0.14 |
| Jun | 24.38 | 25.19 | 0.81 |
| Jul | 25.79 | 26.40 | 0.61 |
| Aug | 25.00 | 26.44 | 1.44 |
| Sep | 22.11 | 22.25 | 0.15 |
| Oct | 17.35 | 17.76 | 0.41 |
| Nov | 12.21 | 12.84 | 0.63 |
| Dec | 7.05 | 7.52 | 0.47 |
| ⌀ Month | 16.70 | 17.43 | 0.73 |
Sunshine (h)
| Month | ⌀ 1940 - 1950 | ⌀ 2013 - 2023 | +/- |
|---|---|---|---|
| Jan | 6.41 | 5.35 | -1.07 |
| Feb | 6.37 | 5.27 | -1.10 |
| Mar | 6.40 | 5.76 | -0.63 |
| Apr | 7.68 | 6.84 | -0.84 |
| May | 8.28 | 7.29 | -0.99 |
| Jun | 7.65 | 7.20 | -0.44 |
| Jul | 8.92 | 8.53 | -0.40 |
| Aug | 8.24 | 8.46 | 0.23 |
| Sep | 6.63 | 5.49 | -1.14 |
| Oct | 5.30 | 4.33 | -0.96 |
| Nov | 5.51 | 4.35 | -1.16 |
| Dec | 6.30 | 5.05 | -1.25 |
| ⌀ Month | 6.97 | 6.16 | -0.81 |
Rain (mm)
| Month | ⌀ 1940 - 1950 | ⌀ 2013 - 2023 | +/- |
|---|---|---|---|
| Jan | 0.11 | 0.33 | 0.22 |
| Feb | 0.32 | 0.67 | 0.35 |
| Mar | 0.83 | 1.22 | 0.40 |
| Apr | 1.78 | 2.41 | 0.62 |
| May | 2.93 | 2.87 | -0.07 |
| Jun | 6.80 | 4.22 | -2.58 |
| Jul | 10.24 | 9.70 | -0.54 |
| Aug | 12.28 | 7.80 | -4.48 |
| Sep | 5.35 | 3.81 | -1.53 |
| Oct | 1.26 | 1.99 | 0.72 |
| Nov | 0.64 | 0.61 | -0.03 |
| Dec | 0.21 | 0.39 | 0.18 |
| ⌀ Month | 3.56 | 3.00 | -0.56 |
Snow (mm)
| Month | ⌀ 1940 - 1950 | ⌀ 2013 - 2023 | +/- |
|---|---|---|---|
| Jan | 0.00 | 0.01 | 0.01 |
| Feb | 0.00 | 0.00 | 0.00 |
| Mar | 0.00 | 0.00 | 0.00 |
| Apr | 0.00 | 0.00 | 0.00 |
| May | 0.00 | 0.00 | 0.00 |
| Jun | 0.00 | 0.00 | 0.00 |
| Jul | 0.00 | 0.00 | 0.00 |
| Aug | 0.00 | 0.00 | 0.00 |
| Sep | 0.00 | 0.00 | 0.00 |
| Oct | 0.00 | 0.00 | 0.00 |
| Nov | 0.00 | 0.00 | 0.00 |
| Dec | 0.00 | 0.01 | 0.01 |
| ⌀ Month | 0.00 | 0.00 | 0.00 |