Climate Change Chart of Chelyabinsk, Russian Federation
Comprehensive Climate Change Chart of Chelyabinsk, Russian Federation: Monthly Averages and Impact Trends
Explore the changing climate in Chelyabinsk, Russian Federation, with insights from temperature, rainfall, snowfall, and sunshine duration data from 1940 - 1950 compared to 2013 - 2024.
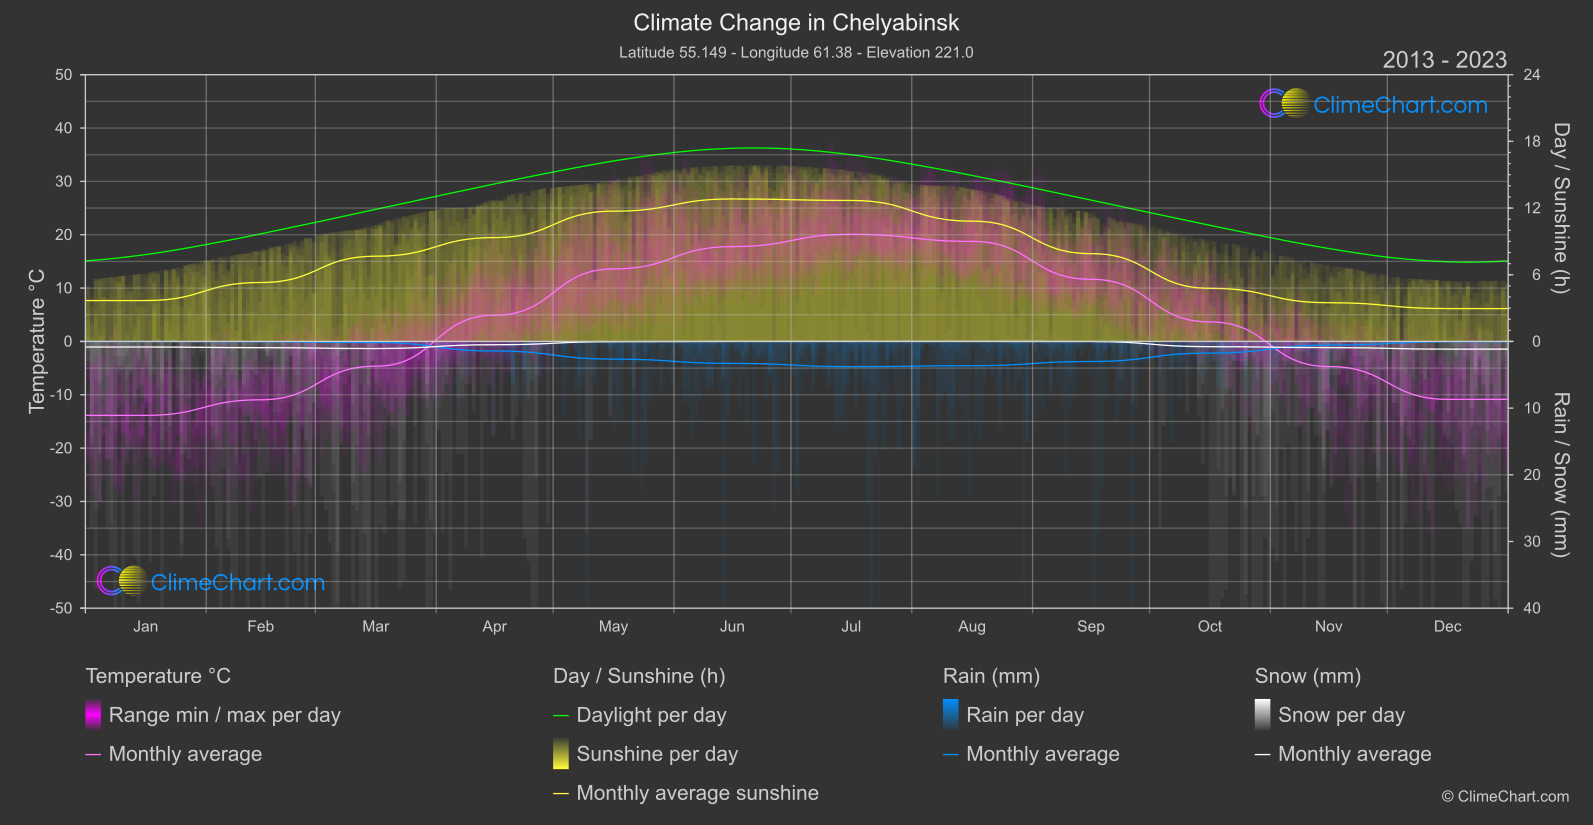
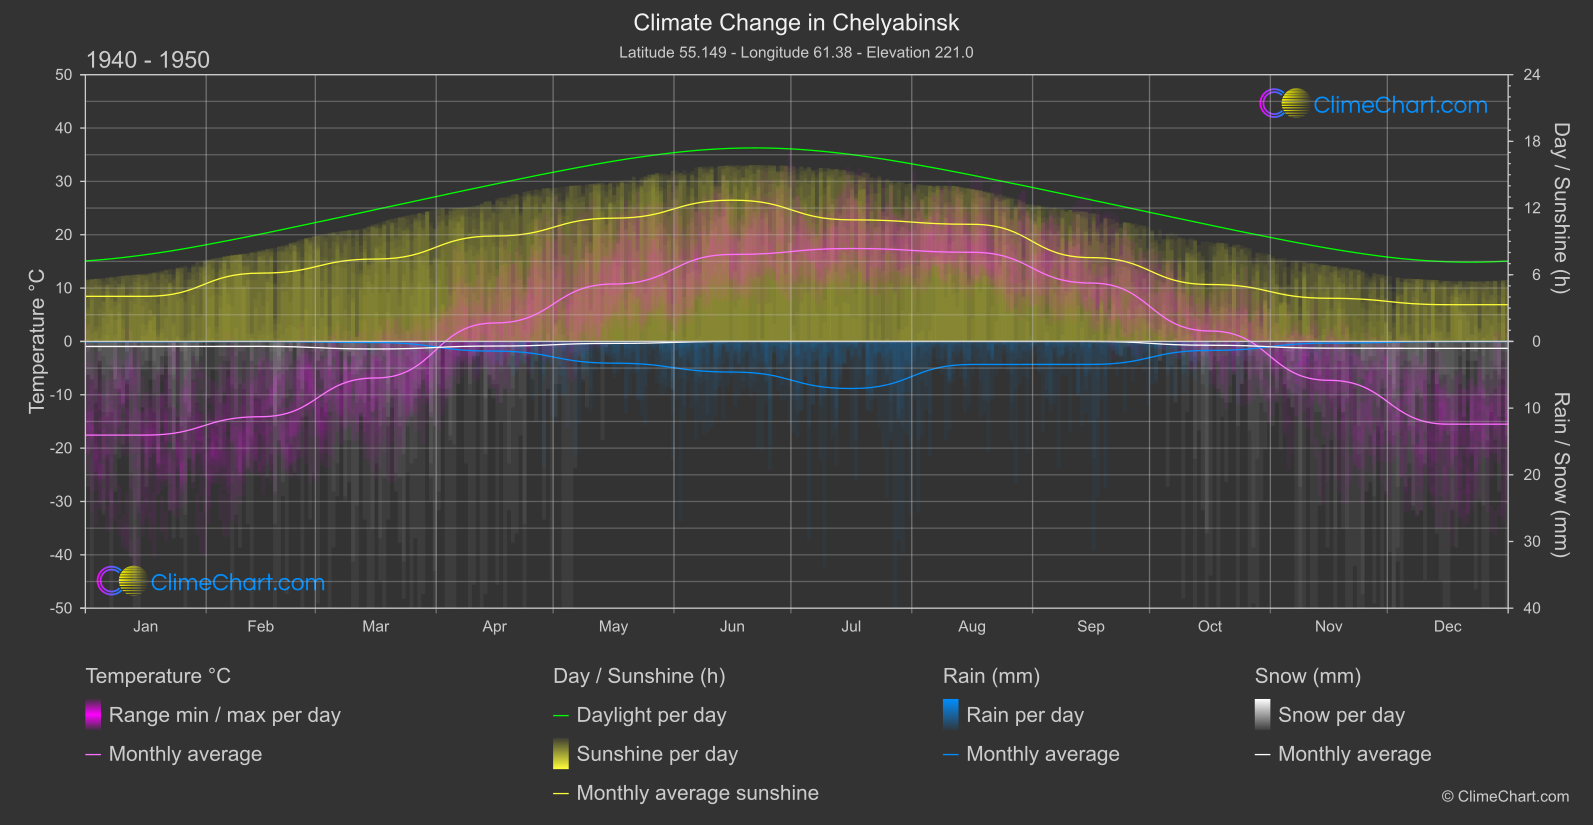
Chelyabinsk, Russian Federation, experiences varying climate changes over the years. From the data, it is evident that December has seen the highest temperature change of 4.65°C, while July has the highest rainfall change of 1.64mm. Snowfall in January has increased by 0.04mm, and sunshine duration in July has significantly risen by 1.74 hours.
Climate Change Data Overview for Chelyabinsk, Russian Federation
Explore the comprehensive climate change data for Chelyabinsk, Russian Federation. This detailed table provides valuable insights into temperature variations, precipitation levels, and seasonal changes influenced by climate change, helping you understand the unique weather patterns of this region.
Temperature °C
| Month | ⌀ 1940 - 1950 | ⌀ 2013 - 2023 | +/- |
|---|---|---|---|
| Jan | -17.56 | -13.86 | 3.70 |
| Feb | -14.11 | -10.94 | 3.17 |
| Mar | -6.85 | -4.64 | 2.21 |
| Apr | 3.46 | 4.92 | 1.47 |
| May | 10.76 | 13.59 | 2.83 |
| Jun | 16.30 | 17.78 | 1.47 |
| Jul | 17.42 | 20.08 | 2.66 |
| Aug | 16.71 | 18.75 | 2.05 |
| Sep | 10.95 | 11.65 | 0.70 |
| Oct | 1.96 | 3.66 | 1.70 |
| Nov | -7.29 | -4.71 | 2.57 |
| Dec | -15.51 | -10.86 | 4.65 |
| ⌀ Month | 1.35 | 3.78 | 2.43 |
Sunshine (h)
| Month | ⌀ 1940 - 1950 | ⌀ 2013 - 2023 | +/- |
|---|---|---|---|
| Jan | 4.06 | 3.68 | -0.38 |
| Feb | 6.15 | 5.30 | -0.84 |
| Mar | 7.41 | 7.67 | 0.25 |
| Apr | 9.49 | 9.34 | -0.14 |
| May | 11.09 | 11.72 | 0.63 |
| Jun | 12.71 | 12.82 | 0.11 |
| Jul | 10.94 | 12.68 | 1.74 |
| Aug | 10.54 | 10.82 | 0.28 |
| Sep | 7.54 | 7.90 | 0.36 |
| Oct | 5.12 | 4.78 | -0.34 |
| Nov | 3.88 | 3.48 | -0.40 |
| Dec | 3.31 | 2.95 | -0.35 |
| ⌀ Month | 7.69 | 7.76 | 0.08 |
Rain (mm)
| Month | ⌀ 1940 - 1950 | ⌀ 2013 - 2023 | +/- |
|---|---|---|---|
| Jan | 0.02 | 0.00 | -0.02 |
| Feb | 0.00 | 0.02 | 0.02 |
| Mar | 0.08 | 0.08 | -0.00 |
| Apr | 0.73 | 0.72 | -0.01 |
| May | 1.63 | 1.33 | -0.30 |
| Jun | 2.29 | 1.65 | -0.64 |
| Jul | 3.53 | 1.89 | -1.64 |
| Aug | 1.72 | 1.82 | 0.10 |
| Sep | 1.72 | 1.50 | -0.22 |
| Oct | 0.67 | 0.87 | 0.20 |
| Nov | 0.13 | 0.28 | 0.15 |
| Dec | 0.01 | 0.03 | 0.02 |
| ⌀ Month | 1.05 | 0.85 | -0.20 |
Snow (mm)
| Month | ⌀ 1940 - 1950 | ⌀ 2013 - 2023 | +/- |
|---|---|---|---|
| Jan | 0.38 | 0.42 | 0.04 |
| Feb | 0.37 | 0.47 | 0.10 |
| Mar | 0.57 | 0.53 | -0.03 |
| Apr | 0.35 | 0.25 | -0.10 |
| May | 0.15 | 0.02 | -0.13 |
| Jun | 0.00 | 0.00 | 0.00 |
| Jul | 0.00 | 0.00 | 0.00 |
| Aug | 0.00 | 0.00 | 0.00 |
| Sep | 0.00 | 0.01 | 0.00 |
| Oct | 0.29 | 0.39 | 0.11 |
| Nov | 0.51 | 0.46 | -0.04 |
| Dec | 0.52 | 0.58 | 0.06 |
| ⌀ Month | 0.26 | 0.26 | 0.00 |