Climate Change Chart of Chania, Greece
Comprehensive Climate Change Chart of Chania, Greece: Monthly Averages and Impact Trends
Explore the changing climate in Chania, Greece with data insights on temperature, rainfall, snow, and sunshine duration. Discover how the climate has evolved from 1940 to 1950 compared to 2013 to 2024.
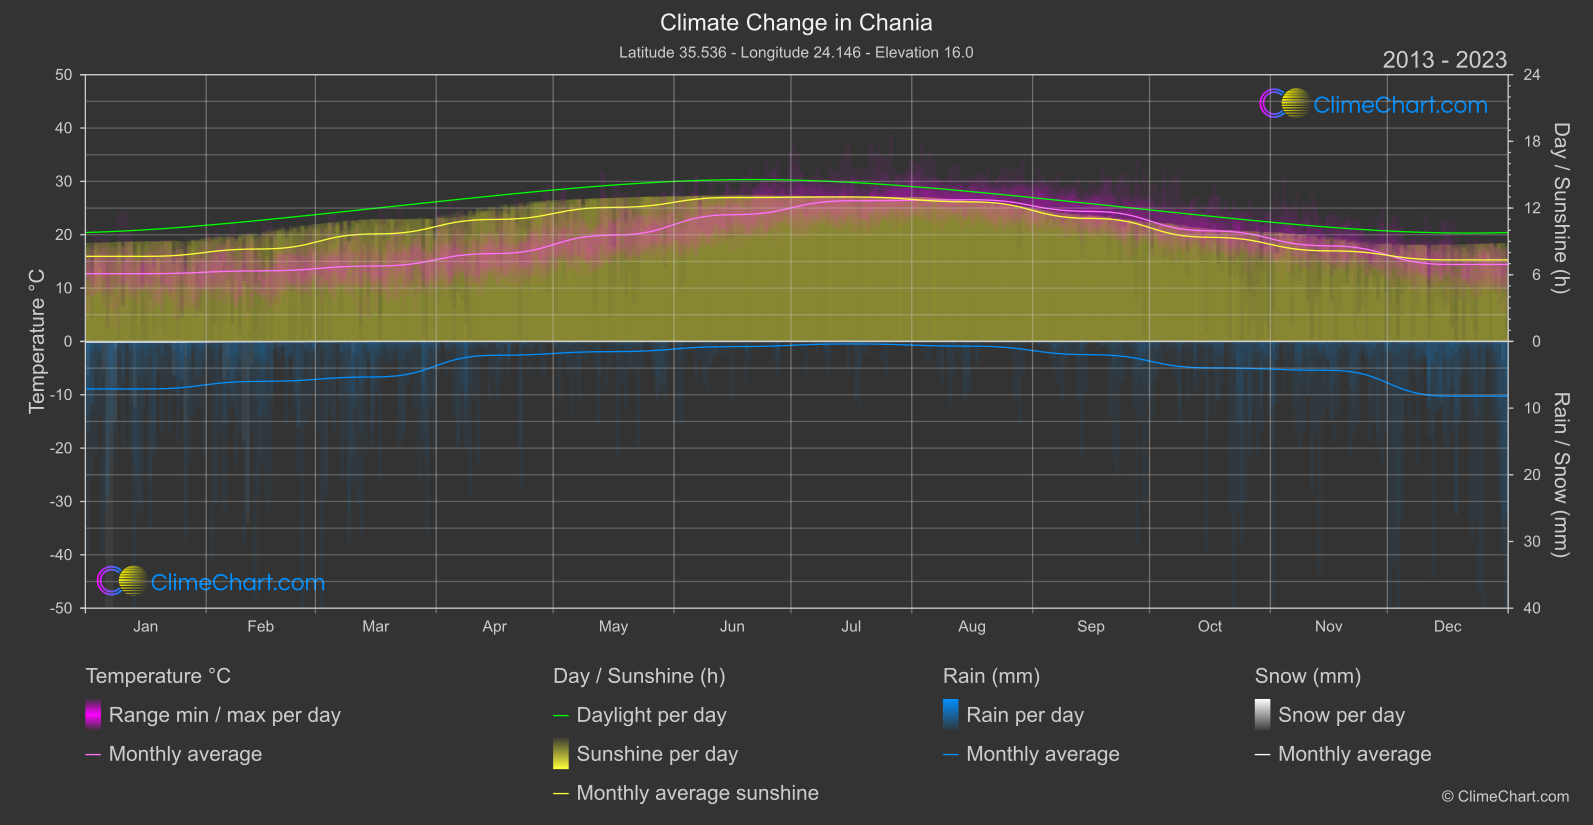
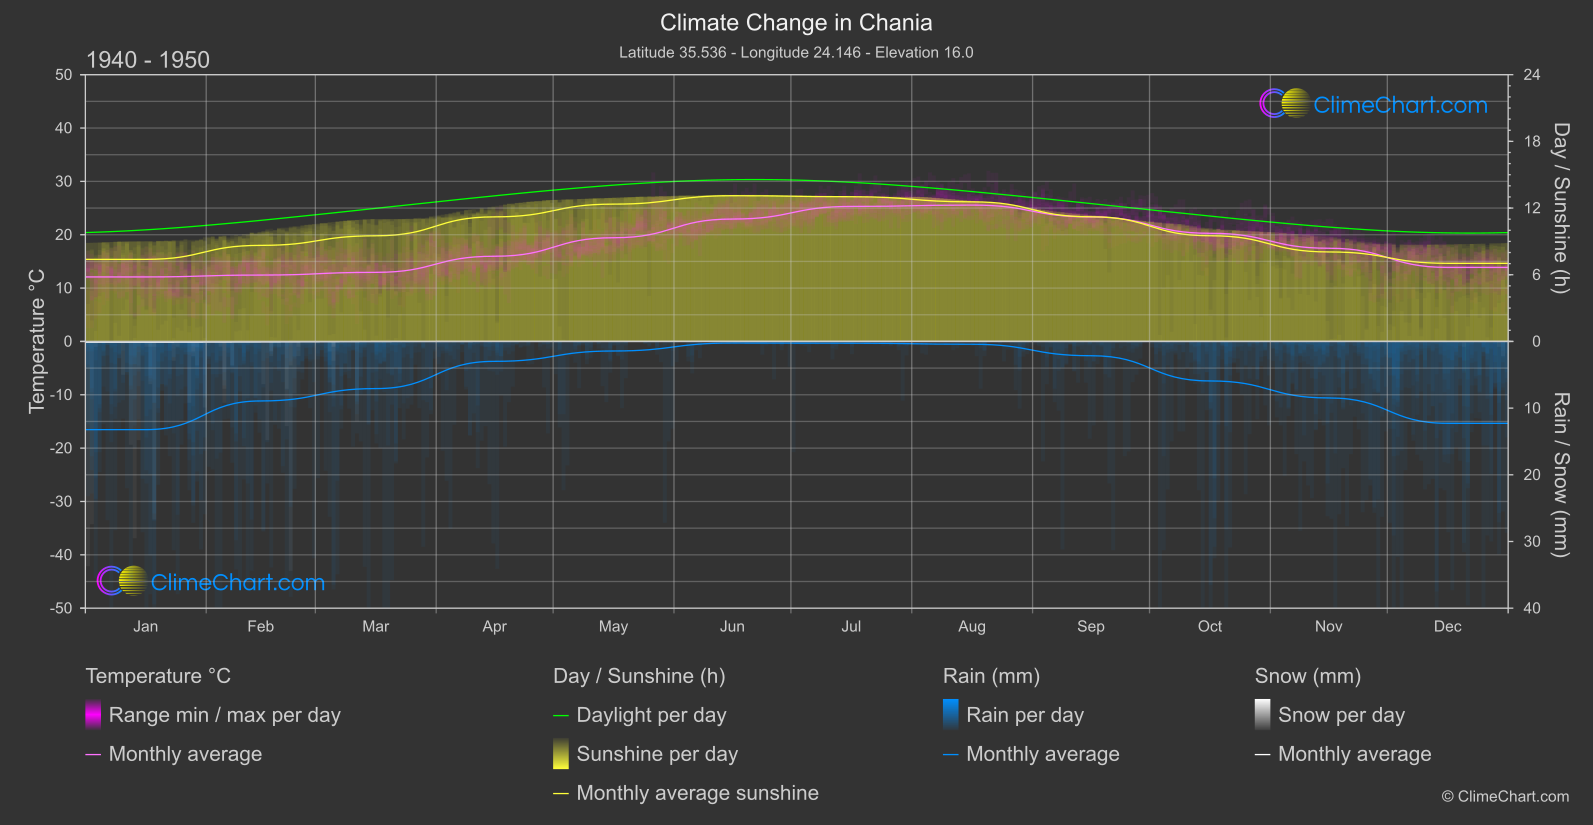
Chania, Greece experiences notable changes in temperature, rainfall, snowfall, and sunshine duration over the years. The data shows that March has the highest temperature change of approximately 1.19°C. Alternatively, November sees the most significant decrease in rainfall, with a change of around -2.07mm. Snowfall remains minimal throughout the year, with no substantial changes observed. Moreover, the sunshine duration displays slight variations, with December showing a rise of 0.31 hours.
Climate Change Data Overview for Chania, Greece
Explore the comprehensive climate change data for Chania, Greece. This detailed table provides valuable insights into temperature variations, precipitation levels, and seasonal changes influenced by climate change, helping you understand the unique weather patterns of this region.
Temperature °C
| Month | ⌀ 1940 - 1950 | ⌀ 2013 - 2023 | +/- |
|---|---|---|---|
| Jan | 12.09 | 12.70 | 0.61 |
| Feb | 12.44 | 13.23 | 0.79 |
| Mar | 12.95 | 14.14 | 1.19 |
| Apr | 15.97 | 16.46 | 0.50 |
| May | 19.44 | 19.93 | 0.49 |
| Jun | 22.94 | 23.75 | 0.81 |
| Jul | 25.31 | 26.38 | 1.07 |
| Aug | 25.56 | 26.56 | 1.00 |
| Sep | 23.34 | 24.37 | 1.03 |
| Oct | 20.27 | 20.73 | 0.47 |
| Nov | 17.47 | 17.91 | 0.45 |
| Dec | 13.88 | 14.43 | 0.56 |
| ⌀ Month | 18.47 | 19.22 | 0.75 |
Sunshine (h)
| Month | ⌀ 1940 - 1950 | ⌀ 2013 - 2023 | +/- |
|---|---|---|---|
| Jan | 7.38 | 7.66 | 0.27 |
| Feb | 8.64 | 8.32 | -0.32 |
| Mar | 9.51 | 9.67 | 0.16 |
| Apr | 11.21 | 10.98 | -0.23 |
| May | 12.35 | 12.06 | -0.29 |
| Jun | 13.11 | 12.95 | -0.16 |
| Jul | 13.02 | 13.00 | -0.02 |
| Aug | 12.56 | 12.56 | -0.00 |
| Sep | 11.21 | 11.07 | -0.14 |
| Oct | 9.51 | 9.37 | -0.14 |
| Nov | 8.05 | 8.15 | 0.10 |
| Dec | 7.03 | 7.34 | 0.31 |
| ⌀ Month | 10.30 | 10.26 | -0.04 |
Rain (mm)
| Month | ⌀ 1940 - 1950 | ⌀ 2013 - 2023 | +/- |
|---|---|---|---|
| Jan | 6.61 | 3.56 | -3.05 |
| Feb | 4.46 | 2.99 | -1.47 |
| Mar | 3.54 | 2.66 | -0.87 |
| Apr | 1.49 | 1.04 | -0.45 |
| May | 0.72 | 0.76 | 0.05 |
| Jun | 0.12 | 0.39 | 0.27 |
| Jul | 0.13 | 0.19 | 0.06 |
| Aug | 0.21 | 0.36 | 0.14 |
| Sep | 1.07 | 0.99 | -0.08 |
| Oct | 2.96 | 1.98 | -0.98 |
| Nov | 4.24 | 2.16 | -2.07 |
| Dec | 6.14 | 4.10 | -2.04 |
| ⌀ Month | 2.64 | 1.77 | -0.88 |
Snow (mm)
| Month | ⌀ 1940 - 1950 | ⌀ 2013 - 2023 | +/- |
|---|---|---|---|
| Jan | 0.06 | 0.05 | -0.00 |
| Feb | 0.04 | 0.02 | -0.02 |
| Mar | 0.01 | 0.00 | -0.01 |
| Apr | 0.00 | 0.00 | 0.00 |
| May | 0.00 | 0.00 | 0.00 |
| Jun | 0.00 | 0.00 | 0.00 |
| Jul | 0.00 | 0.00 | 0.00 |
| Aug | 0.00 | 0.00 | 0.00 |
| Sep | 0.00 | 0.00 | 0.00 |
| Oct | 0.00 | 0.00 | 0.00 |
| Nov | 0.00 | 0.00 | 0.00 |
| Dec | 0.00 | 0.00 | 0.00 |
| ⌀ Month | 0.01 | 0.01 | -0.00 |