Climate Change Chart of Cayenne, French Guiana
Comprehensive Climate Change Chart of Cayenne, French Guiana: Monthly Averages and Impact Trends
Exploring the changing climate in Cayenne, French Guiana reveals intriguing insights into temperature, rainfall, and sunshine duration trends. Discover how the climate has evolved over the years in this tropical region.
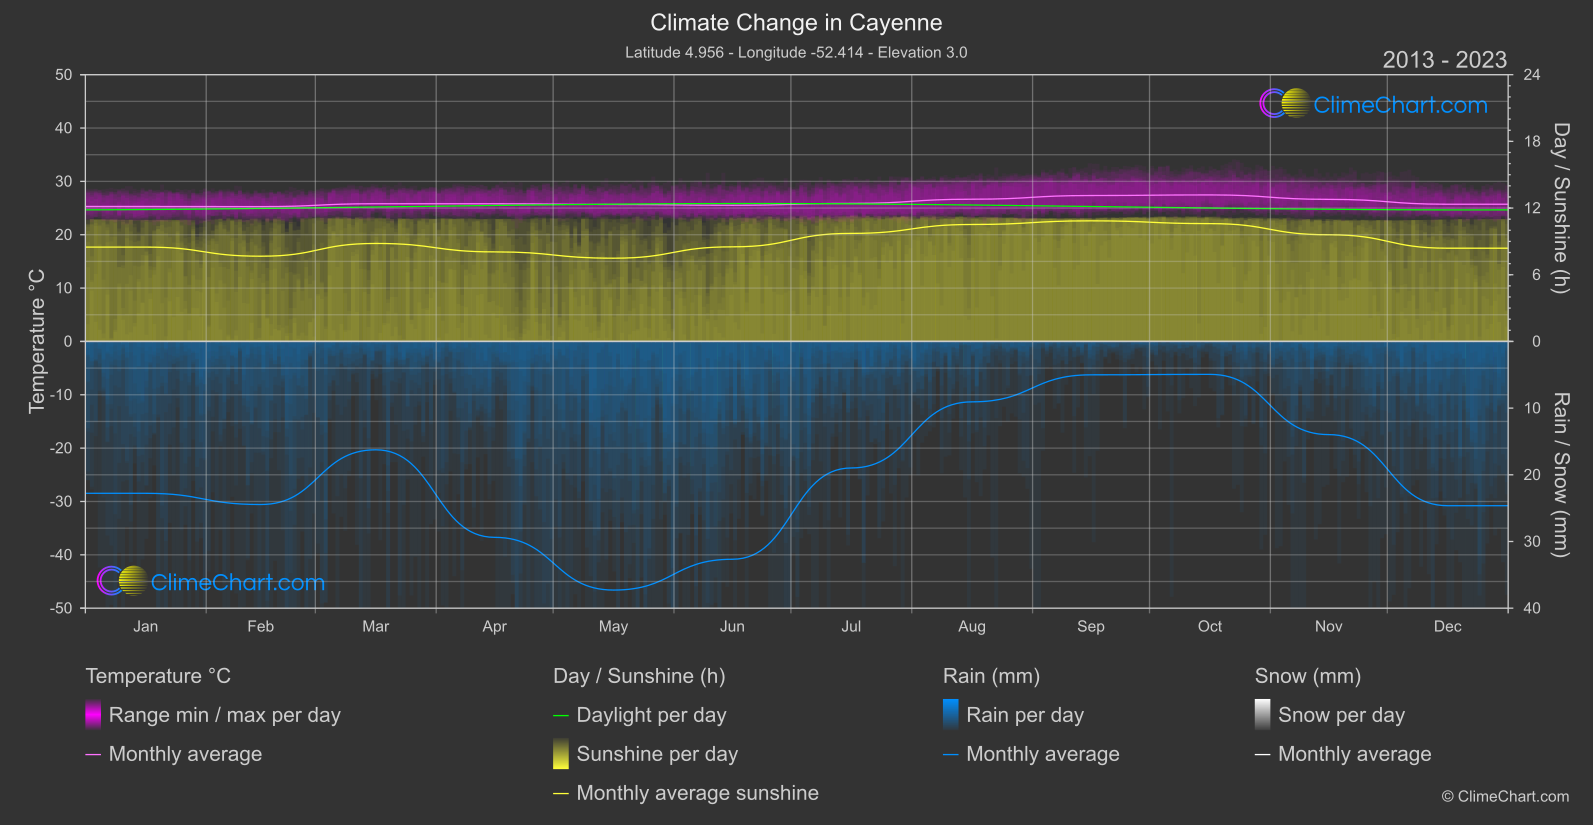
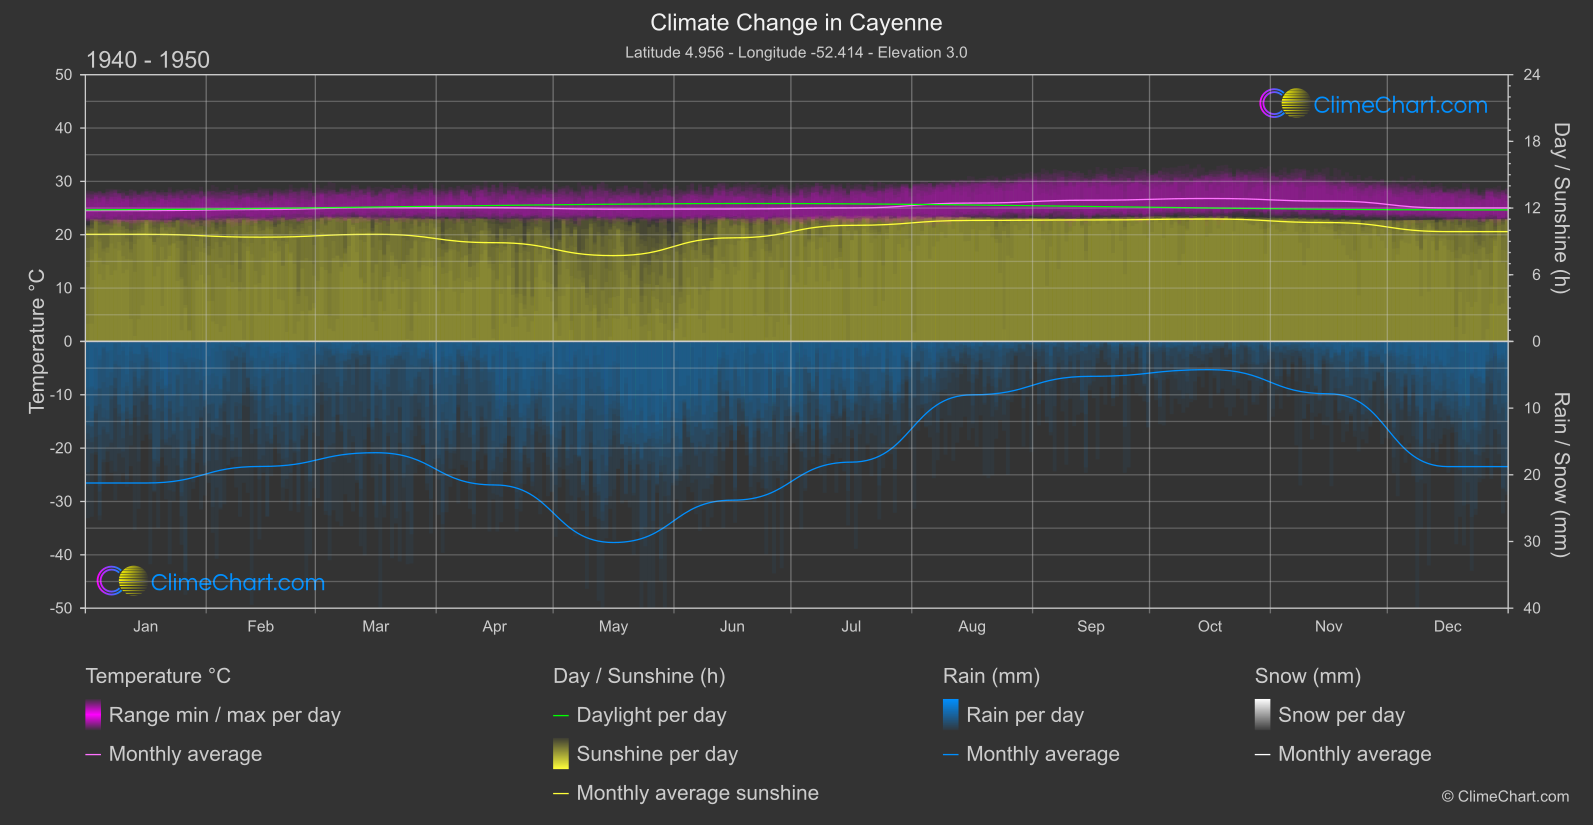
Cayenne, French Guiana, experiences a notable increase in mean temperatures from 1940-1950 to 2013-2024. The month with the highest temperature change is May, showing a significant rise in temperature. In terms of rainfall, there is a varied pattern with some months showing a substantial increase in precipitation like February, while others exhibit a decrease. Sunshine duration also displays fluctuations across the months, with notable reductions in December compared to historical data.
Climate Change Data Overview for Cayenne, French Guiana
Explore the comprehensive climate change data for Cayenne, French Guiana. This detailed table provides valuable insights into temperature variations, precipitation levels, and seasonal changes influenced by climate change, helping you understand the unique weather patterns of this region.
Temperature °C
| Month | ⌀ 1940 - 1950 | ⌀ 2013 - 2023 | +/- |
|---|---|---|---|
| Jan | 24.52 | 25.30 | 0.77 |
| Feb | 24.73 | 25.27 | 0.54 |
| Mar | 25.08 | 25.81 | 0.73 |
| Apr | 25.06 | 25.80 | 0.74 |
| May | 24.78 | 25.67 | 0.88 |
| Jun | 24.83 | 25.53 | 0.70 |
| Jul | 25.02 | 25.87 | 0.85 |
| Aug | 25.94 | 26.66 | 0.72 |
| Sep | 26.48 | 27.35 | 0.87 |
| Oct | 26.79 | 27.46 | 0.67 |
| Nov | 26.30 | 26.63 | 0.33 |
| Dec | 25.02 | 25.72 | 0.69 |
| ⌀ Month | 25.38 | 26.09 | 0.71 |
Sunshine (h)
| Month | ⌀ 1940 - 1950 | ⌀ 2013 - 2023 | +/- |
|---|---|---|---|
| Jan | 9.63 | 8.49 | -1.15 |
| Feb | 9.38 | 7.67 | -1.71 |
| Mar | 9.64 | 8.82 | -0.83 |
| Apr | 8.88 | 8.06 | -0.83 |
| May | 7.72 | 7.49 | -0.23 |
| Jun | 9.32 | 8.51 | -0.81 |
| Jul | 10.44 | 9.72 | -0.72 |
| Aug | 10.89 | 10.52 | -0.37 |
| Sep | 10.93 | 10.85 | -0.08 |
| Oct | 11.01 | 10.60 | -0.41 |
| Nov | 10.69 | 9.60 | -1.10 |
| Dec | 9.88 | 8.39 | -1.49 |
| ⌀ Month | 9.87 | 9.06 | -0.81 |
Rain (mm)
| Month | ⌀ 1940 - 1950 | ⌀ 2013 - 2023 | +/- |
|---|---|---|---|
| Jan | 10.62 | 11.39 | 0.77 |
| Feb | 9.37 | 12.23 | 2.85 |
| Mar | 8.34 | 8.13 | -0.22 |
| Apr | 10.76 | 14.69 | 3.93 |
| May | 15.08 | 18.64 | 3.57 |
| Jun | 11.90 | 16.33 | 4.43 |
| Jul | 9.05 | 9.49 | 0.44 |
| Aug | 4.00 | 4.53 | 0.53 |
| Sep | 2.62 | 2.50 | -0.11 |
| Oct | 2.12 | 2.47 | 0.35 |
| Nov | 3.93 | 6.99 | 3.06 |
| Dec | 9.38 | 12.32 | 2.93 |
| ⌀ Month | 8.10 | 9.97 | 1.88 |
Snow (mm)
| Month | ⌀ 1940 - 1950 | ⌀ 2013 - 2023 | +/- |
|---|---|---|---|
| Jan | 0.00 | 0.00 | 0.00 |
| Feb | 0.00 | 0.00 | 0.00 |
| Mar | 0.00 | 0.00 | 0.00 |
| Apr | 0.00 | 0.00 | 0.00 |
| May | 0.00 | 0.00 | 0.00 |
| Jun | 0.00 | 0.00 | 0.00 |
| Jul | 0.00 | 0.00 | 0.00 |
| Aug | 0.00 | 0.00 | 0.00 |
| Sep | 0.00 | 0.00 | 0.00 |
| Oct | 0.00 | 0.00 | 0.00 |
| Nov | 0.00 | 0.00 | 0.00 |
| Dec | 0.00 | 0.00 | 0.00 |
| ⌀ Month | 0.00 | 0.00 | 0.00 |