Climate Change Chart of Castries, Saint Lucia
Comprehensive Climate Change Chart of Castries, Saint Lucia: Monthly Averages and Impact Trends
Exploring the changing climate in Castries, Saint Lucia reveals intriguing insights into temperature, rainfall, and sunshine duration over the years.
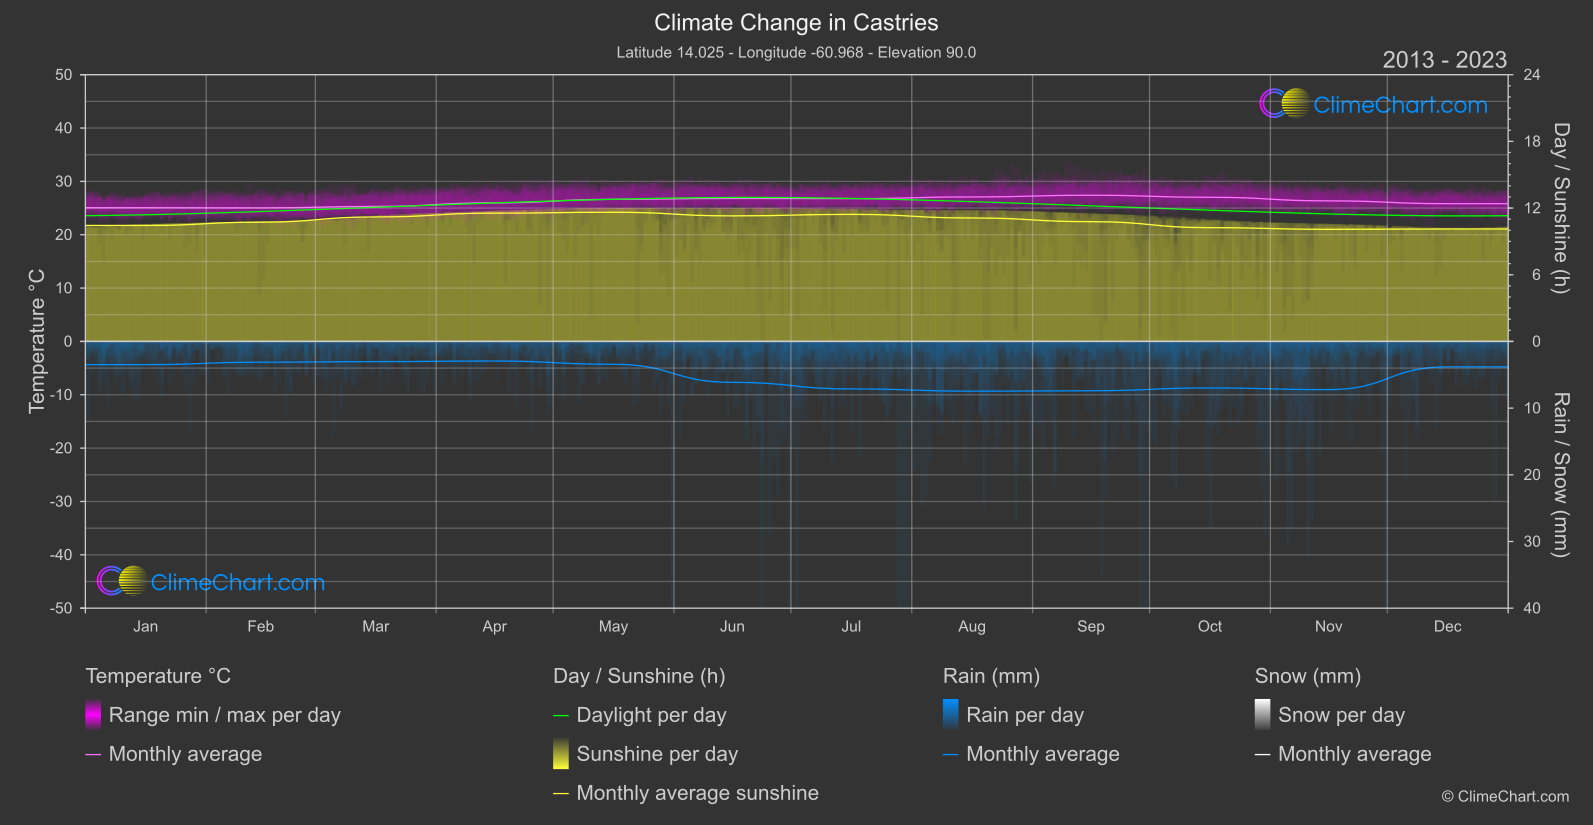
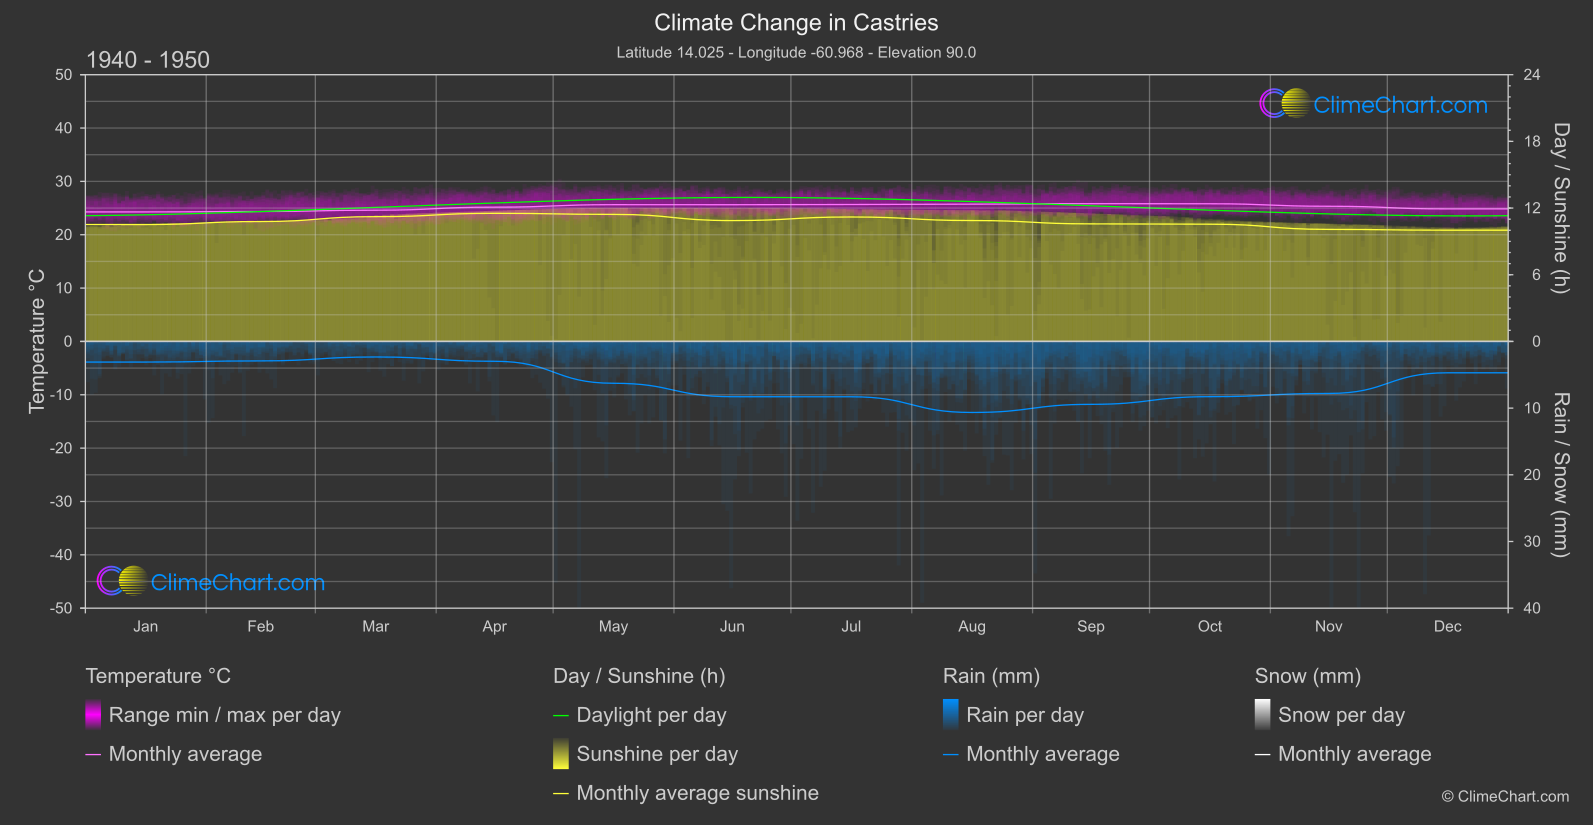
Castries, Saint Lucia experiences notable changes in temperature, with June showing the highest increase compared to the earlier period. On the other hand, rainfall displays variations throughout the year, with May experiencing a significant decrease. The sunshine duration also fluctuates, with June witnessing a substantial rise in sunshine hours. These data highlight the dynamic nature of Castries' climate and the impact of climate change over the years.
Climate Change Data Overview for Castries, Saint Lucia
Explore the comprehensive climate change data for Castries, Saint Lucia. This detailed table provides valuable insights into temperature variations, precipitation levels, and seasonal changes influenced by climate change, helping you understand the unique weather patterns of this region.
Temperature °C
| Month | ⌀ 1940 - 1950 | ⌀ 2013 - 2023 | +/- |
|---|---|---|---|
| Jan | 24.28 | 25.06 | 0.79 |
| Feb | 24.35 | 25.03 | 0.67 |
| Mar | 24.60 | 25.30 | 0.71 |
| Apr | 25.17 | 25.98 | 0.80 |
| May | 25.63 | 26.64 | 1.00 |
| Jun | 25.62 | 26.80 | 1.17 |
| Jul | 25.67 | 26.76 | 1.10 |
| Aug | 25.73 | 27.08 | 1.35 |
| Sep | 25.82 | 27.40 | 1.58 |
| Oct | 25.80 | 27.02 | 1.22 |
| Nov | 25.34 | 26.35 | 1.01 |
| Dec | 24.84 | 25.82 | 0.98 |
| ⌀ Month | 25.24 | 26.27 | 1.03 |
Sunshine (h)
| Month | ⌀ 1940 - 1950 | ⌀ 2013 - 2023 | +/- |
|---|---|---|---|
| Jan | 10.52 | 10.43 | -0.08 |
| Feb | 10.79 | 10.73 | -0.06 |
| Mar | 11.23 | 11.20 | -0.03 |
| Apr | 11.53 | 11.54 | 0.01 |
| May | 11.43 | 11.62 | 0.19 |
| Jun | 10.87 | 11.30 | 0.42 |
| Jul | 11.20 | 11.43 | 0.23 |
| Aug | 10.88 | 11.11 | 0.23 |
| Sep | 10.58 | 10.77 | 0.20 |
| Oct | 10.55 | 10.23 | -0.31 |
| Nov | 10.08 | 10.09 | 0.01 |
| Dec | 10.01 | 10.12 | 0.11 |
| ⌀ Month | 10.80 | 10.88 | 0.08 |
Rain (mm)
| Month | ⌀ 1940 - 1950 | ⌀ 2013 - 2023 | +/- |
|---|---|---|---|
| Jan | 1.55 | 1.74 | 0.19 |
| Feb | 1.46 | 1.56 | 0.10 |
| Mar | 1.16 | 1.51 | 0.35 |
| Apr | 1.49 | 1.47 | -0.02 |
| May | 3.14 | 1.71 | -1.42 |
| Jun | 4.14 | 3.07 | -1.08 |
| Jul | 4.15 | 3.56 | -0.59 |
| Aug | 5.33 | 3.73 | -1.60 |
| Sep | 4.72 | 3.70 | -1.02 |
| Oct | 4.14 | 3.49 | -0.65 |
| Nov | 3.90 | 3.61 | -0.29 |
| Dec | 2.35 | 1.91 | -0.45 |
| ⌀ Month | 3.13 | 2.59 | -0.54 |
Snow (mm)
| Month | ⌀ 1940 - 1950 | ⌀ 2013 - 2023 | +/- |
|---|---|---|---|
| Jan | 0.00 | 0.00 | 0.00 |
| Feb | 0.00 | 0.00 | 0.00 |
| Mar | 0.00 | 0.00 | 0.00 |
| Apr | 0.00 | 0.00 | 0.00 |
| May | 0.00 | 0.00 | 0.00 |
| Jun | 0.00 | 0.00 | 0.00 |
| Jul | 0.00 | 0.00 | 0.00 |
| Aug | 0.00 | 0.00 | 0.00 |
| Sep | 0.00 | 0.00 | 0.00 |
| Oct | 0.00 | 0.00 | 0.00 |
| Nov | 0.00 | 0.00 | 0.00 |
| Dec | 0.00 | 0.00 | 0.00 |
| ⌀ Month | 0.00 | 0.00 | 0.00 |