Climate Change Chart of Busan, South Korea
Comprehensive Climate Change Chart of Busan, South Korea: Monthly Averages and Impact Trends
Explore the changing climate data of Busan, South Korea, and gain insights into the temperature, rainfall, snowfall, and sunshine duration trends over the years.
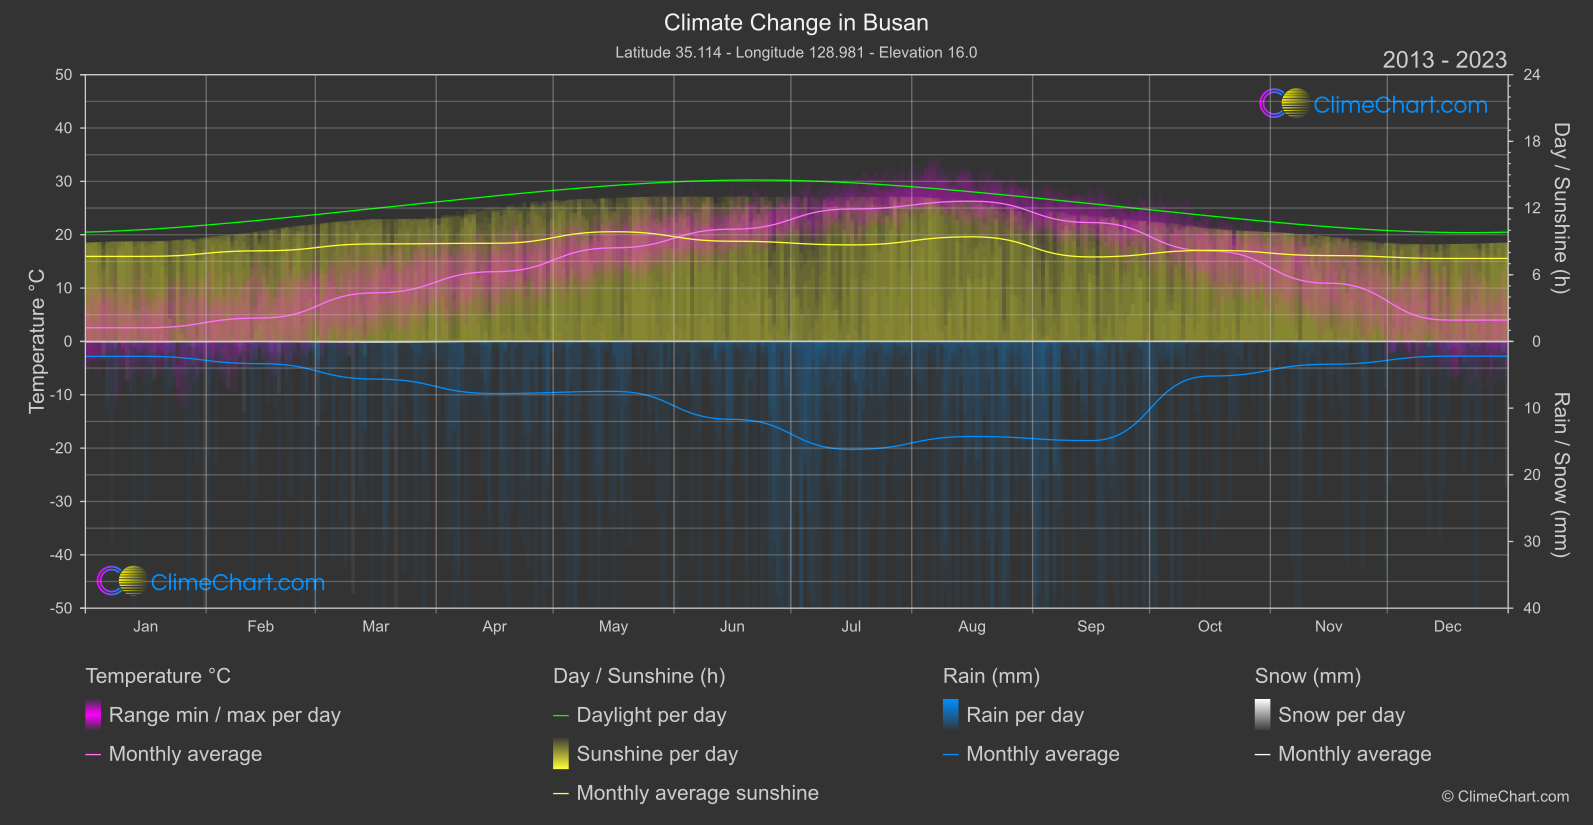
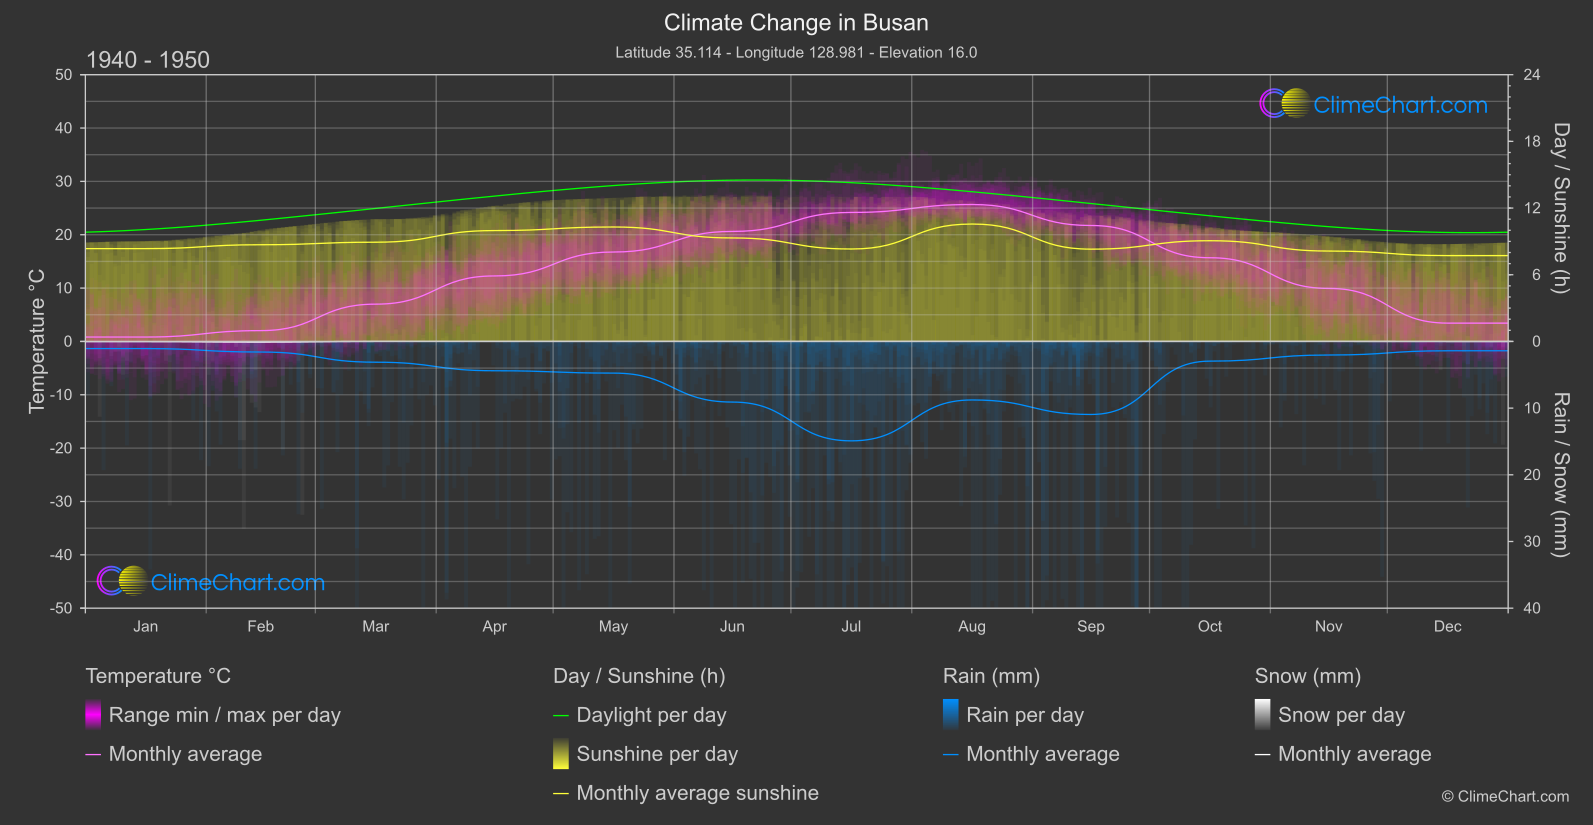
Busan, a coastal city in South Korea, has been experiencing notable changes in its climate patterns. The data shows a clear increase in average temperatures from 1940 to 1950 compared to the period between 2013 and 2024. Interestingly, the month of March stands out with a significant temperature rise of 2.13°C. In terms of rainfall, October shows the highest change with an increase of 1.12mm. Snowfall in Busan has generally decreased over the years, with February experiencing the most significant reduction. Additionally, sunshine duration has seen fluctuations, with August witnessing a notable decrease of around 1.15 hours of sunshine.
Climate Change Data Overview for Busan, South Korea
Explore the comprehensive climate change data for Busan, South Korea. This detailed table provides valuable insights into temperature variations, precipitation levels, and seasonal changes influenced by climate change, helping you understand the unique weather patterns of this region.
Temperature °C
| Month | ⌀ 1940 - 1950 | ⌀ 2013 - 2023 | +/- |
|---|---|---|---|
| Jan | 0.82 | 2.56 | 1.74 |
| Feb | 2.03 | 4.39 | 2.36 |
| Mar | 6.99 | 9.12 | 2.13 |
| Apr | 12.28 | 13.07 | 0.80 |
| May | 16.76 | 17.54 | 0.78 |
| Jun | 20.62 | 21.04 | 0.42 |
| Jul | 24.18 | 24.83 | 0.65 |
| Aug | 25.66 | 26.28 | 0.62 |
| Sep | 21.73 | 22.28 | 0.55 |
| Oct | 15.69 | 16.95 | 1.27 |
| Nov | 9.94 | 10.91 | 0.97 |
| Dec | 3.43 | 4.01 | 0.57 |
| ⌀ Month | 13.34 | 14.42 | 1.07 |
Sunshine (h)
| Month | ⌀ 1940 - 1950 | ⌀ 2013 - 2023 | +/- |
|---|---|---|---|
| Jan | 8.35 | 7.65 | -0.70 |
| Feb | 8.70 | 8.15 | -0.54 |
| Mar | 8.93 | 8.77 | -0.15 |
| Apr | 9.97 | 8.83 | -1.14 |
| May | 10.30 | 9.87 | -0.43 |
| Jun | 9.31 | 9.01 | -0.30 |
| Jul | 8.32 | 8.69 | 0.37 |
| Aug | 10.56 | 9.41 | -1.15 |
| Sep | 8.30 | 7.60 | -0.70 |
| Oct | 9.06 | 8.20 | -0.86 |
| Nov | 8.13 | 7.72 | -0.41 |
| Dec | 7.72 | 7.47 | -0.26 |
| ⌀ Month | 8.97 | 8.45 | -0.52 |
Rain (mm)
| Month | ⌀ 1940 - 1950 | ⌀ 2013 - 2023 | +/- |
|---|---|---|---|
| Jan | 0.54 | 1.12 | 0.59 |
| Feb | 0.79 | 1.67 | 0.87 |
| Mar | 1.56 | 2.82 | 1.27 |
| Apr | 2.20 | 3.91 | 1.71 |
| May | 2.37 | 3.75 | 1.37 |
| Jun | 4.55 | 5.84 | 1.30 |
| Jul | 7.45 | 8.10 | 0.64 |
| Aug | 4.39 | 7.13 | 2.74 |
| Sep | 5.48 | 7.44 | 1.96 |
| Oct | 1.48 | 2.60 | 1.12 |
| Nov | 1.02 | 1.71 | 0.69 |
| Dec | 0.70 | 1.10 | 0.40 |
| ⌀ Month | 2.71 | 3.93 | 1.22 |
Snow (mm)
| Month | ⌀ 1940 - 1950 | ⌀ 2013 - 2023 | +/- |
|---|---|---|---|
| Jan | 0.02 | 0.02 | 0.01 |
| Feb | 0.05 | 0.01 | -0.04 |
| Mar | 0.00 | 0.04 | 0.04 |
| Apr | 0.00 | 0.00 | 0.00 |
| May | 0.00 | 0.00 | 0.00 |
| Jun | 0.00 | 0.00 | 0.00 |
| Jul | 0.00 | 0.00 | 0.00 |
| Aug | 0.00 | 0.00 | 0.00 |
| Sep | 0.00 | 0.00 | 0.00 |
| Oct | 0.00 | 0.00 | 0.00 |
| Nov | 0.00 | 0.00 | 0.00 |
| Dec | 0.01 | 0.01 | 0.01 |
| ⌀ Month | 0.01 | 0.01 | 0.00 |