Climate Change Chart of Bujumbura, Burundi
Comprehensive Climate Change Chart of Bujumbura, Burundi: Monthly Averages and Impact Trends
Explore the changing climate in Bujumbura, Burundi with insightful data analysis.
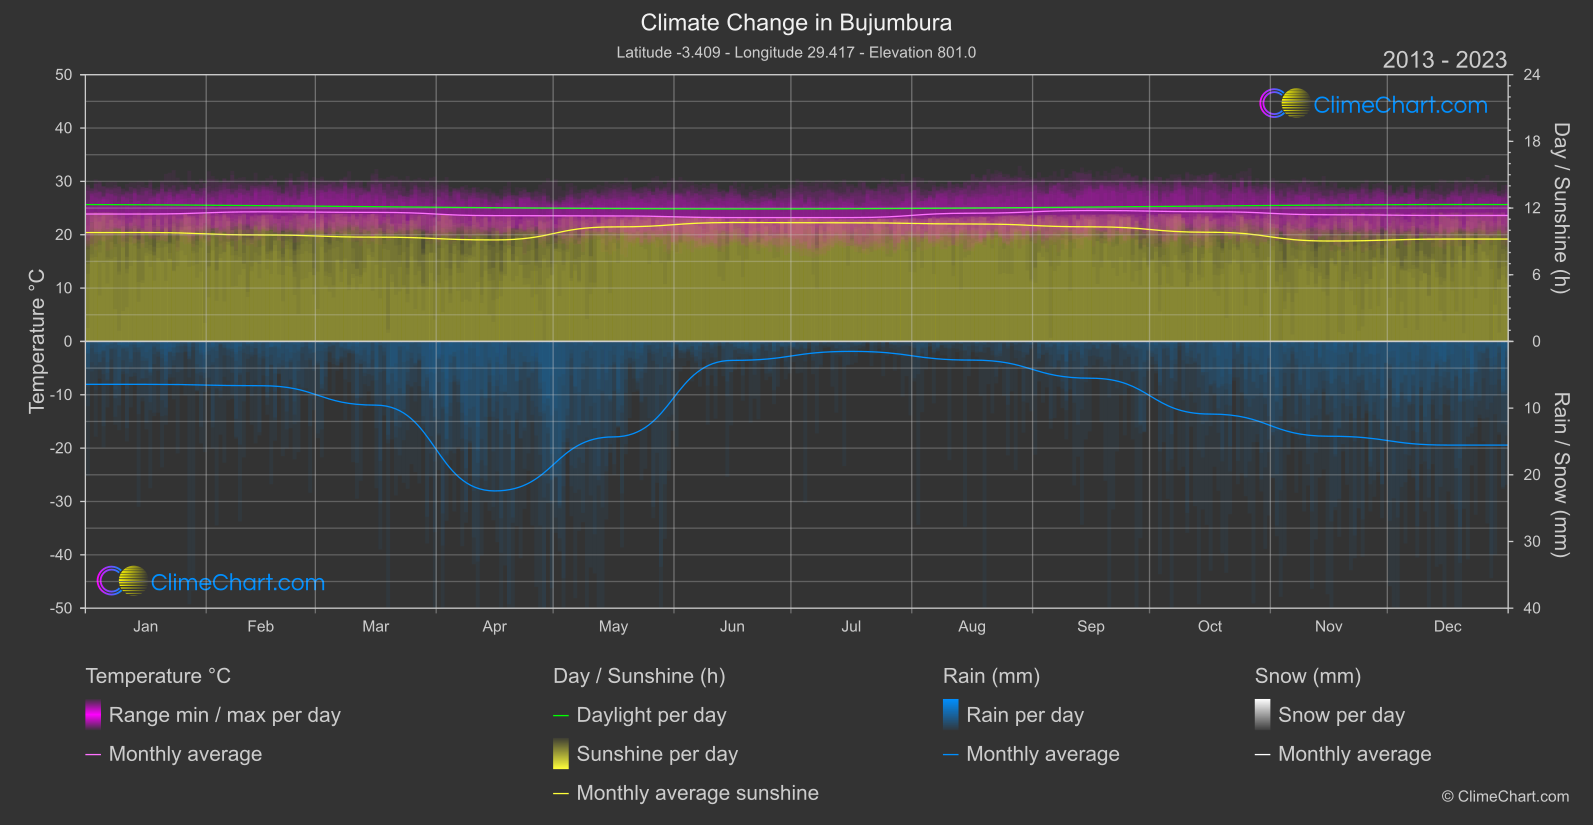
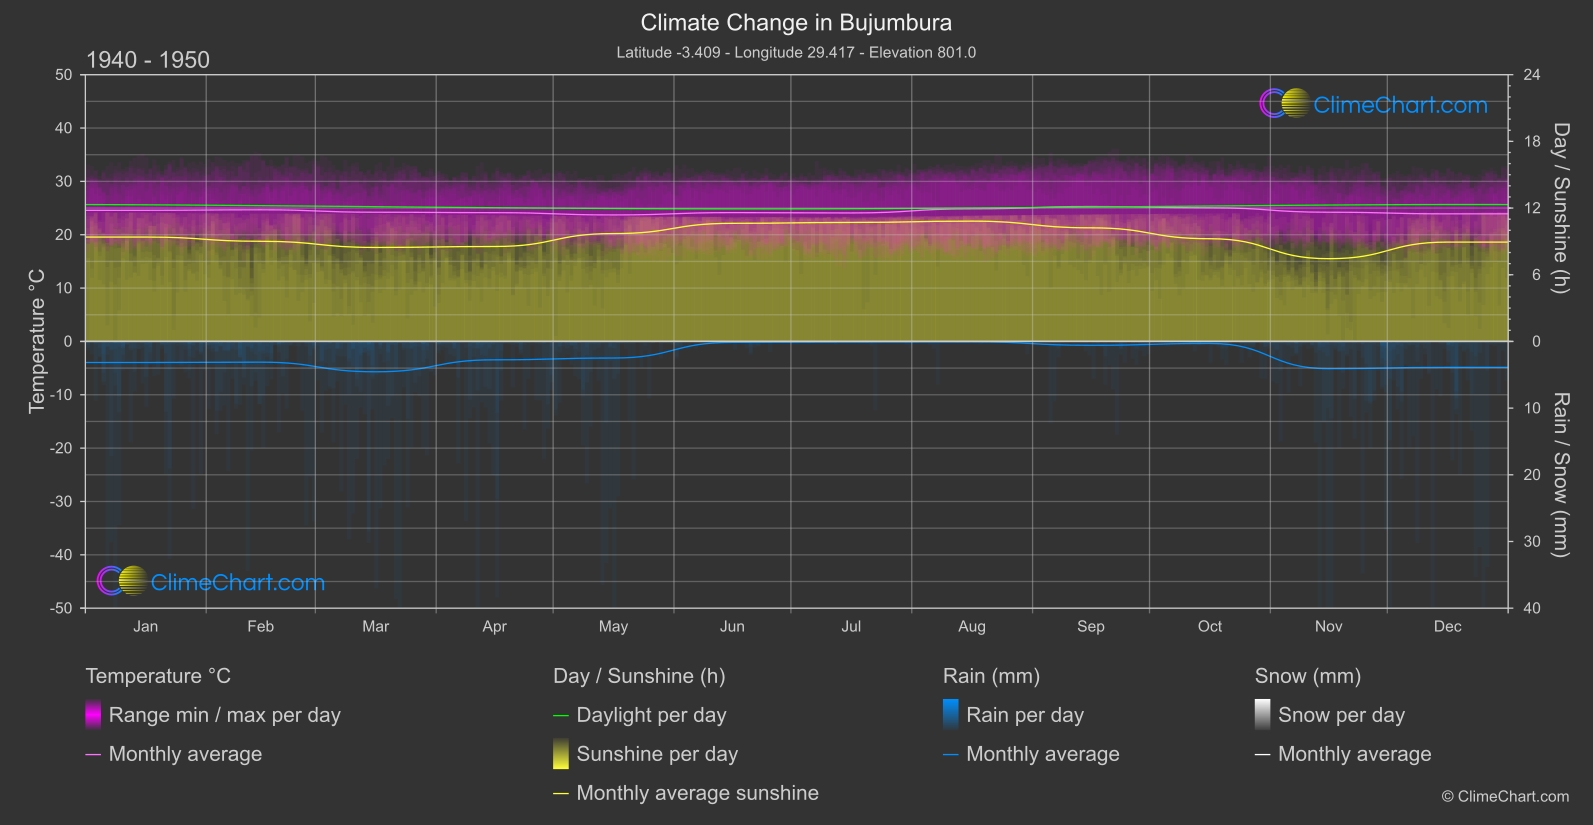
Bujumbura, Burundi experiences noticeable changes in temperature, rainfall, and sunshine duration over the years. From the data comparison between 1940-1950 and 2013-2024, it is evident that the month of April shows the highest change in temperature with a decrease of 0.5548°C. In terms of rainfall, the most significant change occurs in April with an increase of 9.83mm. However, sunshine duration remains relatively stable throughout the year, with November showing the highest increase of 1.5904 hours.
Climate Change Data Overview for Bujumbura, Burundi
Explore the comprehensive climate change data for Bujumbura, Burundi. This detailed table provides valuable insights into temperature variations, precipitation levels, and seasonal changes influenced by climate change, helping you understand the unique weather patterns of this region.
Temperature °C
| Month | ⌀ 1940 - 1950 | ⌀ 2013 - 2023 | +/- |
|---|---|---|---|
| Jan | 24.58 | 23.88 | -0.69 |
| Feb | 24.67 | 24.29 | -0.38 |
| Mar | 24.22 | 24.19 | -0.03 |
| Apr | 24.14 | 23.58 | -0.55 |
| May | 23.71 | 23.52 | -0.19 |
| Jun | 24.15 | 23.22 | -0.93 |
| Jul | 24.08 | 23.22 | -0.87 |
| Aug | 24.85 | 24.04 | -0.82 |
| Sep | 25.29 | 24.54 | -0.75 |
| Oct | 25.05 | 24.31 | -0.74 |
| Nov | 24.22 | 23.74 | -0.47 |
| Dec | 23.92 | 23.61 | -0.31 |
| ⌀ Month | 24.41 | 23.84 | -0.56 |
Sunshine (h)
| Month | ⌀ 1940 - 1950 | ⌀ 2013 - 2023 | +/- |
|---|---|---|---|
| Jan | 9.39 | 9.79 | 0.40 |
| Feb | 9.01 | 9.58 | 0.57 |
| Mar | 8.46 | 9.38 | 0.93 |
| Apr | 8.54 | 9.13 | 0.59 |
| May | 9.70 | 10.30 | 0.60 |
| Jun | 10.63 | 10.70 | 0.07 |
| Jul | 10.71 | 10.67 | -0.03 |
| Aug | 10.82 | 10.57 | -0.26 |
| Sep | 10.22 | 10.31 | 0.09 |
| Oct | 9.24 | 9.82 | 0.58 |
| Nov | 7.44 | 9.04 | 1.59 |
| Dec | 8.94 | 9.21 | 0.27 |
| ⌀ Month | 9.43 | 9.88 | 0.45 |
Rain (mm)
| Month | ⌀ 1940 - 1950 | ⌀ 2013 - 2023 | +/- |
|---|---|---|---|
| Jan | 1.58 | 3.22 | 1.64 |
| Feb | 1.55 | 3.32 | 1.77 |
| Mar | 2.28 | 4.78 | 2.50 |
| Apr | 1.38 | 11.21 | 9.83 |
| May | 1.24 | 7.16 | 5.91 |
| Jun | 0.07 | 1.42 | 1.35 |
| Jul | 0.04 | 0.75 | 0.70 |
| Aug | 0.03 | 1.40 | 1.37 |
| Sep | 0.29 | 2.76 | 2.47 |
| Oct | 0.15 | 5.45 | 5.29 |
| Nov | 2.04 | 7.11 | 5.07 |
| Dec | 1.94 | 7.77 | 5.83 |
| ⌀ Month | 1.05 | 4.69 | 3.64 |
Snow (mm)
| Month | ⌀ 1940 - 1950 | ⌀ 2013 - 2023 | +/- |
|---|---|---|---|
| Jan | 0.00 | 0.00 | 0.00 |
| Feb | 0.00 | 0.00 | 0.00 |
| Mar | 0.00 | 0.00 | 0.00 |
| Apr | 0.00 | 0.00 | 0.00 |
| May | 0.00 | 0.00 | 0.00 |
| Jun | 0.00 | 0.00 | 0.00 |
| Jul | 0.00 | 0.00 | 0.00 |
| Aug | 0.00 | 0.00 | 0.00 |
| Sep | 0.00 | 0.00 | 0.00 |
| Oct | 0.00 | 0.00 | 0.00 |
| Nov | 0.00 | 0.00 | 0.00 |
| Dec | 0.00 | 0.00 | 0.00 |
| ⌀ Month | 0.00 | 0.00 | 0.00 |