Climate Change Chart of Bucharest, Romania
Comprehensive Climate Change Chart of Bucharest, Romania: Monthly Averages and Impact Trends
Explore the climate change data for Bucharest, Romania, showcasing the evolving temperatures, rainfall, snowfall, and sunshine duration from 1940 to 1950 compared to 2013 to 2024.
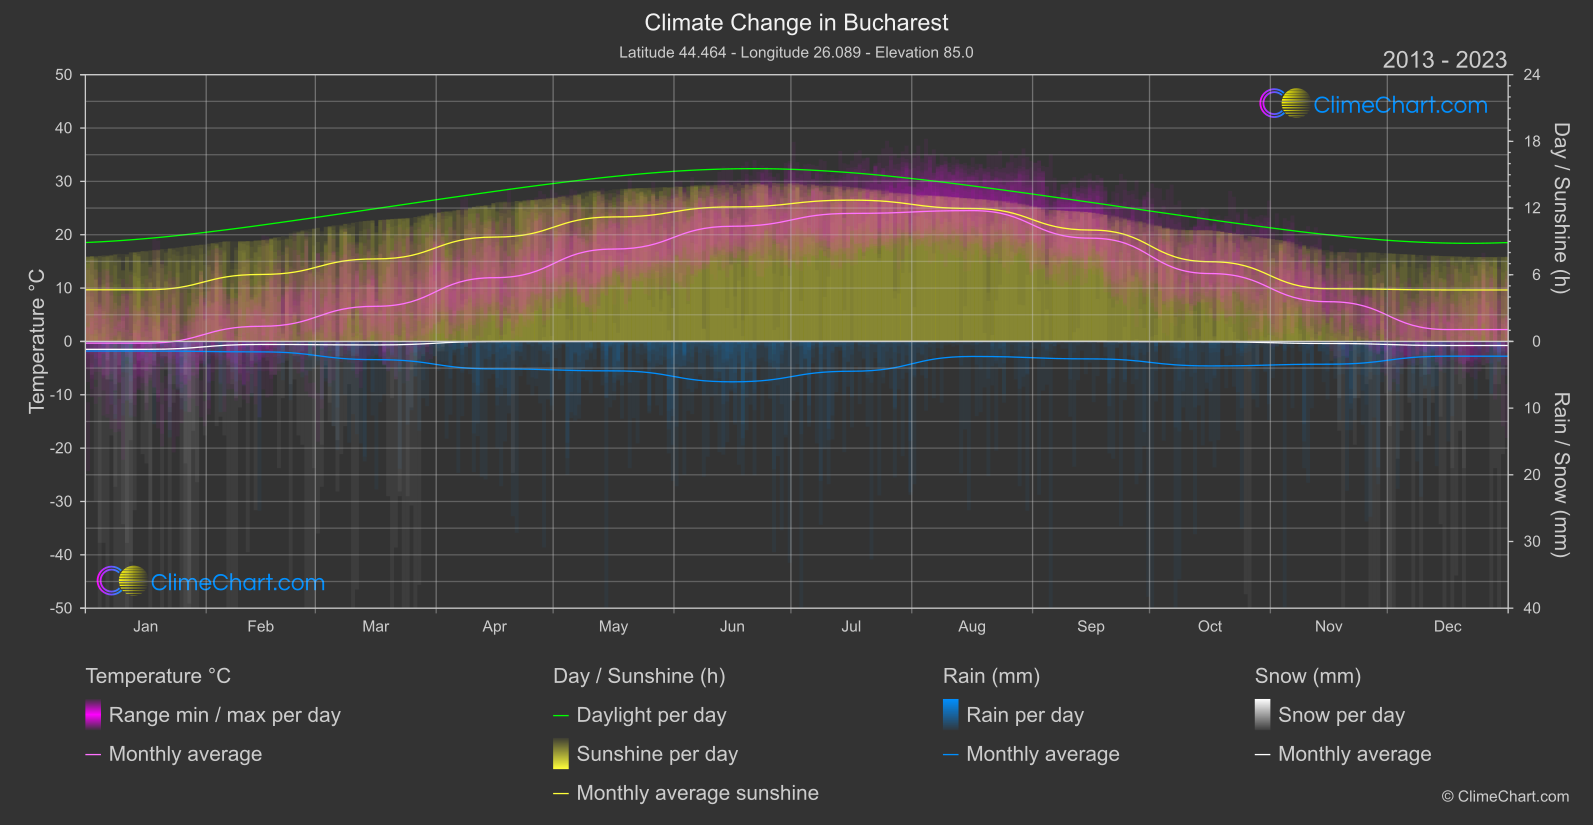
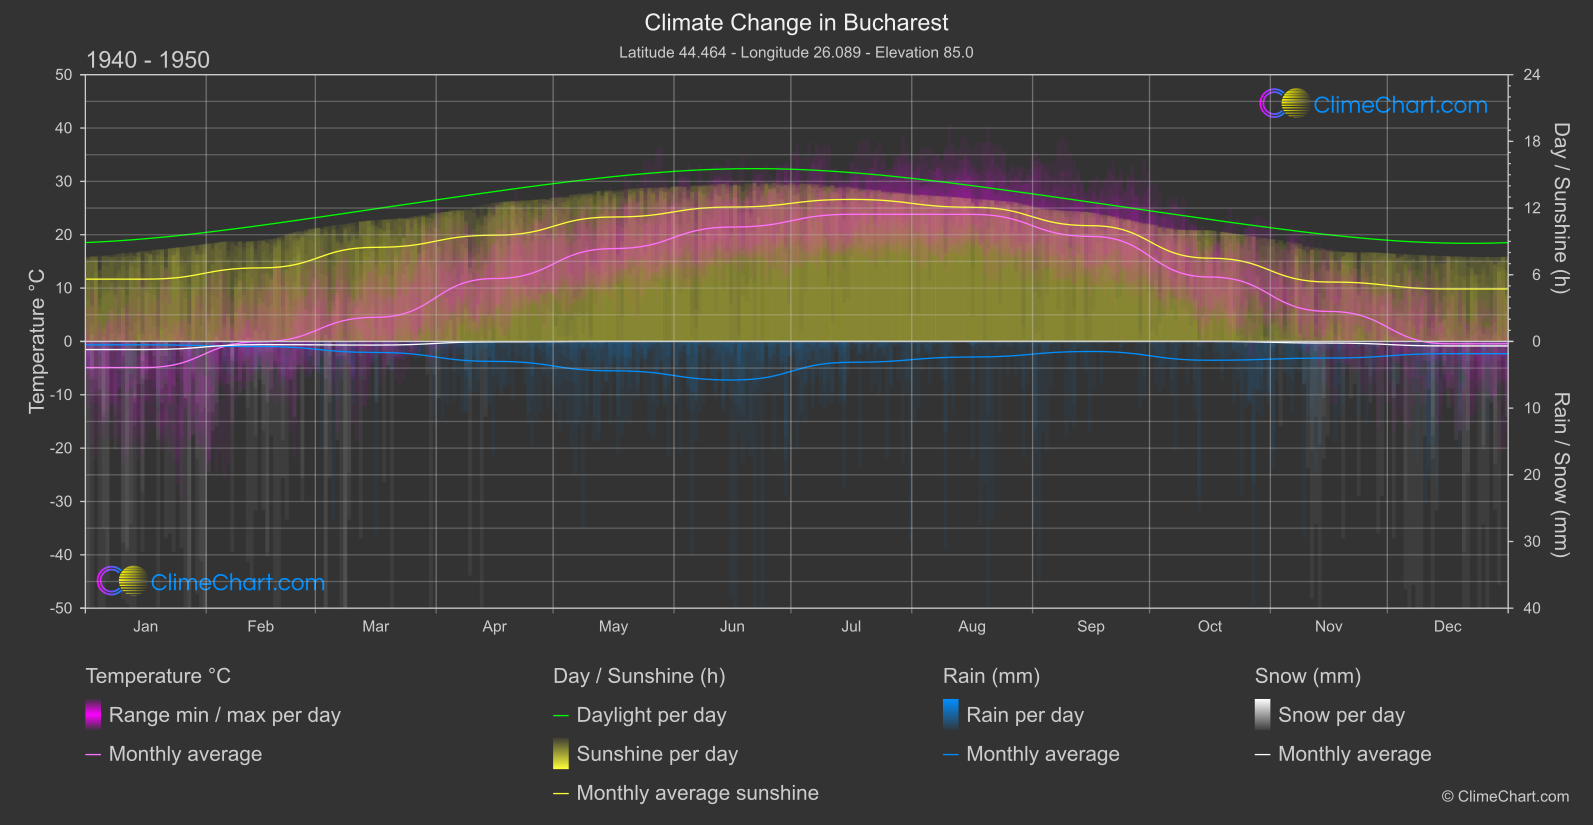
Bucharest, the capital of Romania, has experienced noticeable shifts in its climate over the years. Analyzing the temperature data, we observe that March saw the highest increase in temperature, while September showed a decrease. Rainfall patterns also changed, with July experiencing the most significant rise in precipitation. Snowfall remained relatively stable throughout the months, except for October, which saw a notable increase. Sunshine duration fluctuated, with a general decrease noted towards the end of the year. These trends highlight the impact of climate change on Bucharest's weather patterns.
Climate Change Data Overview for Bucharest, Romania
Explore the comprehensive climate change data for Bucharest, Romania. This detailed table provides valuable insights into temperature variations, precipitation levels, and seasonal changes influenced by climate change, helping you understand the unique weather patterns of this region.
Temperature °C
| Month | ⌀ 1940 - 1950 | ⌀ 2013 - 2023 | +/- |
|---|---|---|---|
| Jan | -4.88 | -0.32 | 4.57 |
| Feb | -0.05 | 2.84 | 2.89 |
| Mar | 4.52 | 6.59 | 2.06 |
| Apr | 11.79 | 11.95 | 0.16 |
| May | 17.40 | 17.31 | -0.09 |
| Jun | 21.45 | 21.59 | 0.14 |
| Jul | 23.83 | 24.00 | 0.17 |
| Aug | 23.82 | 24.52 | 0.71 |
| Sep | 19.68 | 19.35 | -0.33 |
| Oct | 12.07 | 12.72 | 0.66 |
| Nov | 5.62 | 7.45 | 1.83 |
| Dec | -0.43 | 2.22 | 2.66 |
| ⌀ Month | 11.23 | 12.52 | 1.28 |
Sunshine (h)
| Month | ⌀ 1940 - 1950 | ⌀ 2013 - 2023 | +/- |
|---|---|---|---|
| Jan | 5.60 | 4.65 | -0.96 |
| Feb | 6.62 | 6.03 | -0.59 |
| Mar | 8.47 | 7.42 | -1.04 |
| Apr | 9.56 | 9.39 | -0.17 |
| May | 11.20 | 11.20 | 0.01 |
| Jun | 12.09 | 12.10 | 0.01 |
| Jul | 12.78 | 12.71 | -0.06 |
| Aug | 12.07 | 11.96 | -0.11 |
| Sep | 10.41 | 10.02 | -0.39 |
| Oct | 7.49 | 7.17 | -0.32 |
| Nov | 5.35 | 4.75 | -0.60 |
| Dec | 4.72 | 4.63 | -0.09 |
| ⌀ Month | 8.86 | 8.50 | -0.36 |
Rain (mm)
| Month | ⌀ 1940 - 1950 | ⌀ 2013 - 2023 | +/- |
|---|---|---|---|
| Jan | 0.25 | 0.72 | 0.47 |
| Feb | 0.38 | 0.78 | 0.40 |
| Mar | 0.83 | 1.37 | 0.54 |
| Apr | 1.50 | 2.06 | 0.56 |
| May | 2.20 | 2.21 | 0.00 |
| Jun | 2.89 | 3.03 | 0.14 |
| Jul | 1.56 | 2.23 | 0.67 |
| Aug | 1.17 | 1.13 | -0.04 |
| Sep | 0.75 | 1.31 | 0.56 |
| Oct | 1.41 | 1.83 | 0.42 |
| Nov | 1.25 | 1.71 | 0.46 |
| Dec | 0.92 | 1.11 | 0.19 |
| ⌀ Month | 1.26 | 1.62 | 0.36 |
Snow (mm)
| Month | ⌀ 1940 - 1950 | ⌀ 2013 - 2023 | +/- |
|---|---|---|---|
| Jan | 0.61 | 0.59 | -0.01 |
| Feb | 0.24 | 0.23 | -0.01 |
| Mar | 0.27 | 0.26 | -0.01 |
| Apr | 0.03 | 0.01 | -0.02 |
| May | 0.00 | 0.00 | 0.00 |
| Jun | 0.00 | 0.00 | 0.00 |
| Jul | 0.00 | 0.00 | 0.00 |
| Aug | 0.00 | 0.00 | 0.00 |
| Sep | 0.00 | 0.00 | 0.00 |
| Oct | 0.00 | 0.03 | 0.03 |
| Nov | 0.12 | 0.15 | 0.03 |
| Dec | 0.34 | 0.30 | -0.03 |
| ⌀ Month | 0.13 | 0.13 | -0.00 |