Climate Change Chart of Bristol, Great Britain
Comprehensive Climate Change Chart of Bristol, Great Britain: Monthly Averages and Impact Trends
Explore the changing climate in Bristol, United Kingdom, with insights on temperature, rainfall, snowfall, and sunshine duration. Discover how climate patterns have evolved from the 1940s to the 2020s.
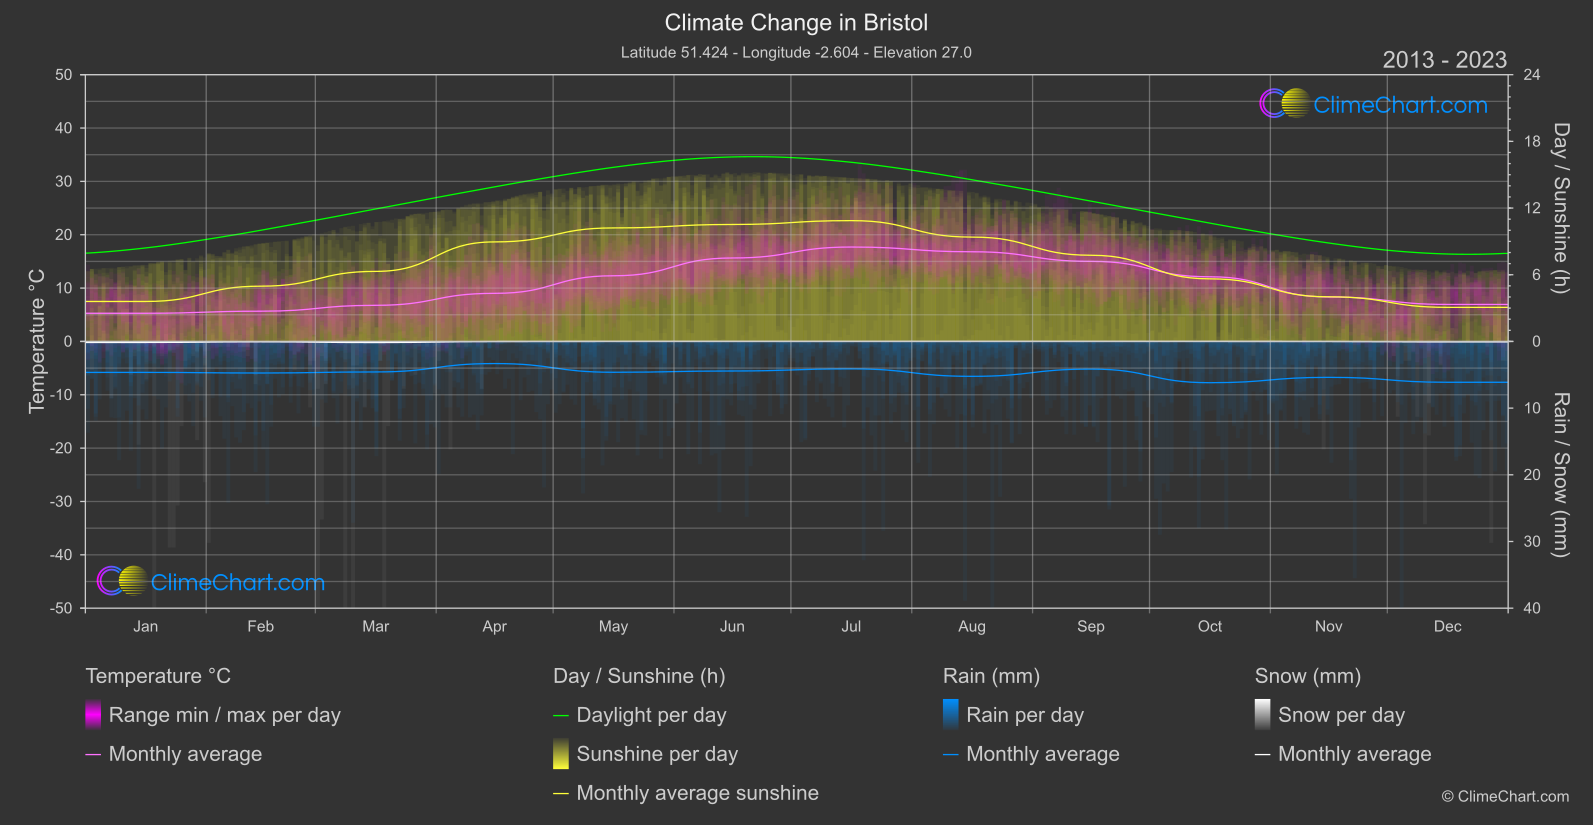
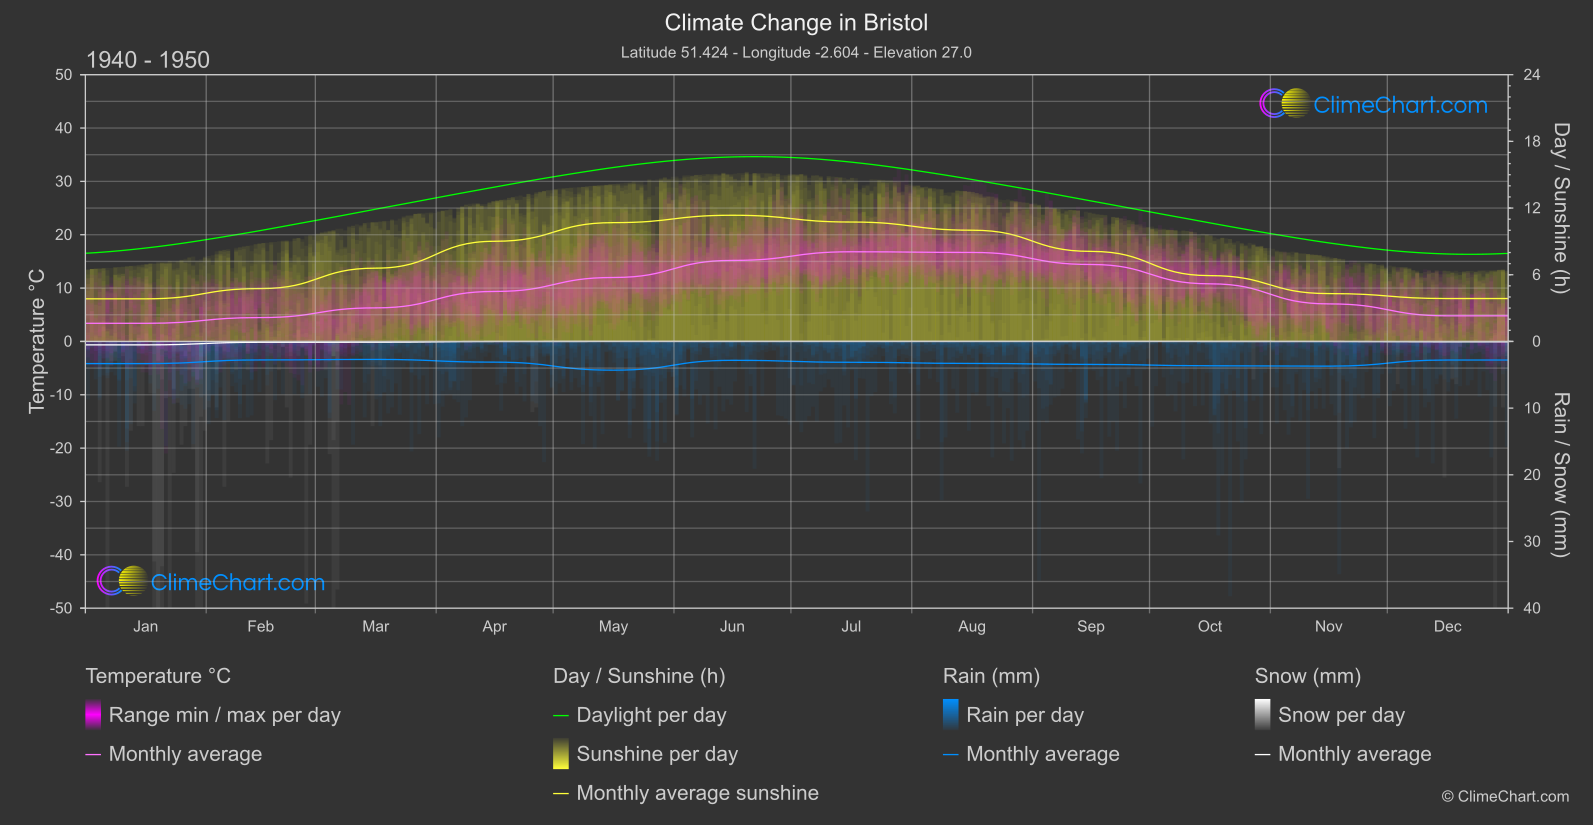
Bristol, located in the southwest of England, has experienced notable changes in its climate over the decades. Analyzing the temperature data reveals that December saw the highest temperature increase between the 1940s and 2020s, with a significant rise of 2.1375°C. On the other hand, rainfall patterns exhibit a varying trend, with the largest increase in precipitation observed in December, showing a rise of 1.6669 mm. Snowfall in Bristol has generally decreased, with January experiencing the most significant reduction of 0.1816 mm. Additionally, the duration of sunshine has fluctuated, with June witnessing the largest decrease in sunshine hours at 0.8294 hours.
Climate Change Data Overview for Bristol, Great Britain
Explore the comprehensive climate change data for Bristol, Great Britain. This detailed table provides valuable insights into temperature variations, precipitation levels, and seasonal changes influenced by climate change, helping you understand the unique weather patterns of this region.
Temperature °C
| Month | ⌀ 1940 - 1950 | ⌀ 2013 - 2023 | +/- |
|---|---|---|---|
| Jan | 3.40 | 5.28 | 1.88 |
| Feb | 4.48 | 5.67 | 1.19 |
| Mar | 6.29 | 6.77 | 0.48 |
| Apr | 9.37 | 9.01 | -0.36 |
| May | 11.99 | 12.31 | 0.32 |
| Jun | 15.19 | 15.64 | 0.46 |
| Jul | 16.81 | 17.69 | 0.89 |
| Aug | 16.68 | 16.81 | 0.13 |
| Sep | 14.42 | 15.01 | 0.58 |
| Oct | 10.80 | 12.12 | 1.32 |
| Nov | 7.04 | 8.33 | 1.29 |
| Dec | 4.80 | 6.94 | 2.14 |
| ⌀ Month | 10.10 | 10.96 | 0.86 |
Sunshine (h)
| Month | ⌀ 1940 - 1950 | ⌀ 2013 - 2023 | +/- |
|---|---|---|---|
| Jan | 3.83 | 3.60 | -0.24 |
| Feb | 4.76 | 4.97 | 0.22 |
| Mar | 6.59 | 6.30 | -0.29 |
| Apr | 9.01 | 8.95 | -0.06 |
| May | 10.69 | 10.21 | -0.48 |
| Jun | 11.35 | 10.52 | -0.83 |
| Jul | 10.74 | 10.87 | 0.13 |
| Aug | 10.01 | 9.39 | -0.62 |
| Sep | 8.10 | 7.75 | -0.35 |
| Oct | 5.92 | 5.63 | -0.29 |
| Nov | 4.30 | 4.01 | -0.29 |
| Dec | 3.86 | 3.06 | -0.79 |
| ⌀ Month | 7.43 | 7.11 | -0.32 |
Rain (mm)
| Month | ⌀ 1940 - 1950 | ⌀ 2013 - 2023 | +/- |
|---|---|---|---|
| Jan | 1.66 | 2.32 | 0.66 |
| Feb | 1.39 | 2.37 | 0.98 |
| Mar | 1.35 | 2.29 | 0.94 |
| Apr | 1.55 | 1.66 | 0.11 |
| May | 2.15 | 2.31 | 0.16 |
| Jun | 1.42 | 2.22 | 0.80 |
| Jul | 1.56 | 2.06 | 0.49 |
| Aug | 1.65 | 2.62 | 0.97 |
| Sep | 1.72 | 2.07 | 0.35 |
| Oct | 1.82 | 3.09 | 1.27 |
| Nov | 1.85 | 2.69 | 0.84 |
| Dec | 1.40 | 3.06 | 1.67 |
| ⌀ Month | 1.63 | 2.40 | 0.77 |
Snow (mm)
| Month | ⌀ 1940 - 1950 | ⌀ 2013 - 2023 | +/- |
|---|---|---|---|
| Jan | 0.26 | 0.08 | -0.18 |
| Feb | 0.06 | 0.03 | -0.04 |
| Mar | 0.06 | 0.08 | 0.02 |
| Apr | 0.01 | 0.01 | 0.00 |
| May | 0.00 | 0.00 | 0.00 |
| Jun | 0.00 | 0.00 | 0.00 |
| Jul | 0.00 | 0.00 | 0.00 |
| Aug | 0.00 | 0.00 | 0.00 |
| Sep | 0.00 | 0.00 | 0.00 |
| Oct | 0.00 | 0.00 | -0.00 |
| Nov | 0.01 | 0.01 | 0.00 |
| Dec | 0.03 | 0.04 | 0.01 |
| ⌀ Month | 0.04 | 0.02 | -0.02 |