Climate Change Chart of Boston, USA
Comprehensive Climate Change Chart of Boston, USA: Monthly Averages and Impact Trends
Exploring the changing climate of Boston, USA reveals intriguing insights on temperature, rainfall, snowfall, and sunshine duration.
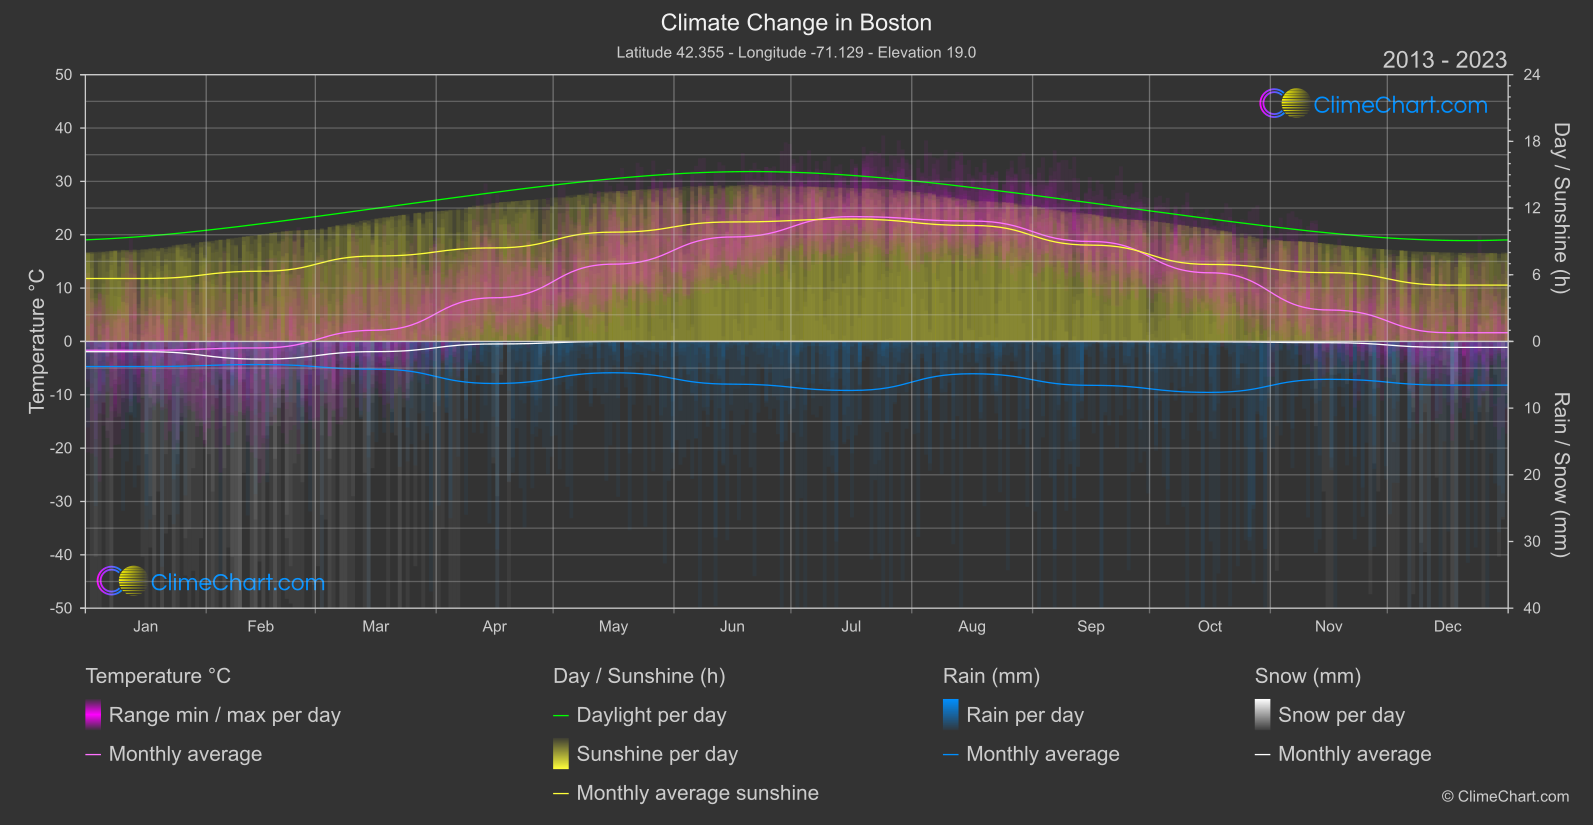
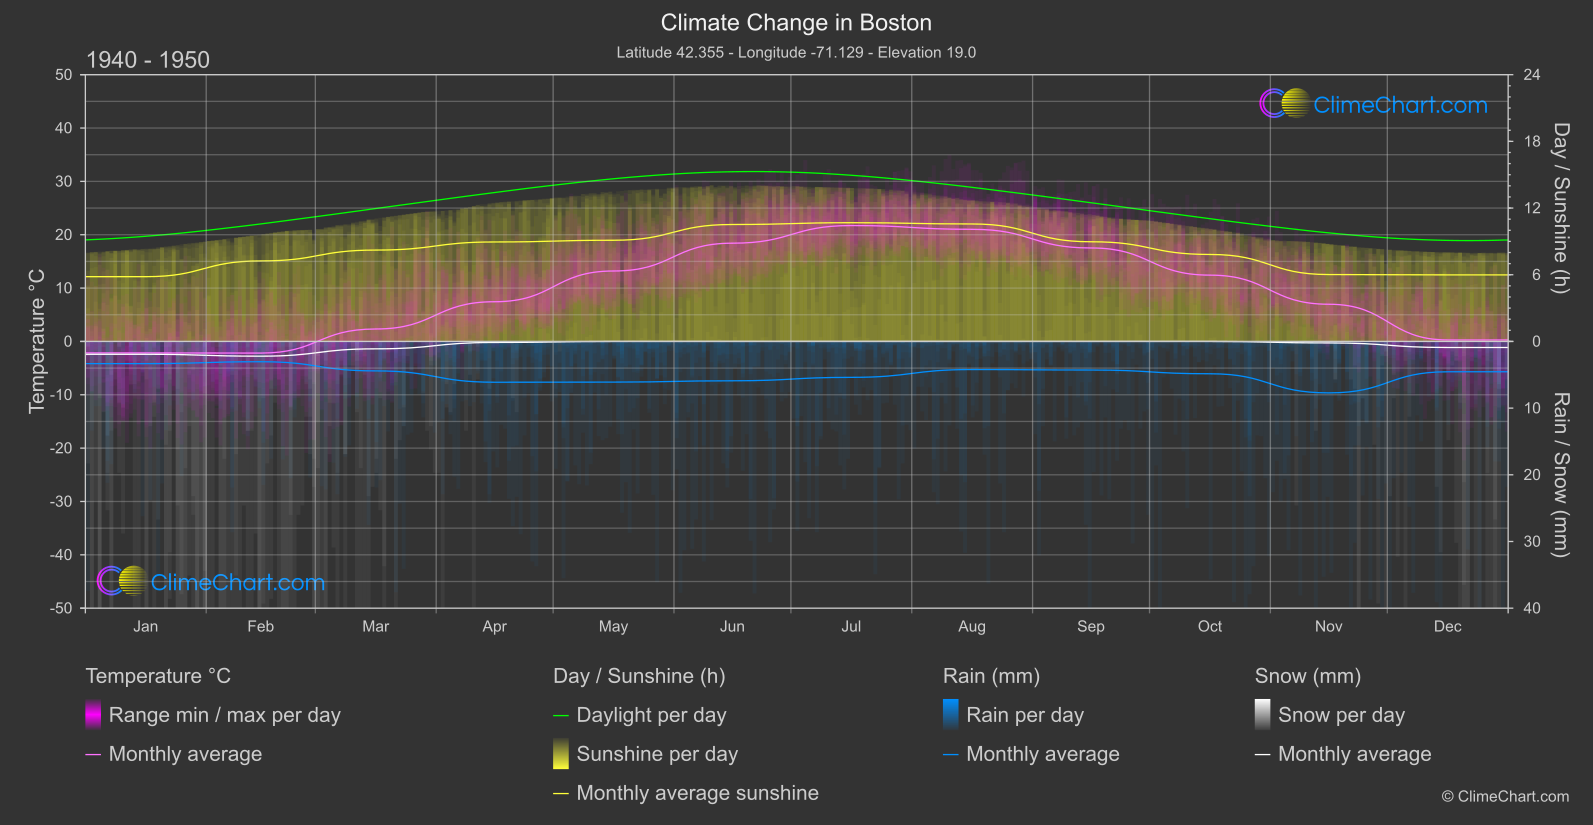
Boston, USA experiences notable changes in climate, with temperature variations from 1940-1950 to 2013-2024. The month with the highest temperature change is July, showing an increase of 1.68°C. In terms of rainfall, October sees the most significant change with an increase of 1.40mm. Snowfall in Boston has generally decreased over the years, with minimal to no snowfall reported in summer months. Sunshine duration also displays fluctuations, with June experiencing the highest increase of 0.73 hours of sunshine.
Climate Change Data Overview for Boston, USA
Explore the comprehensive climate change data for Boston, USA. This detailed table provides valuable insights into temperature variations, precipitation levels, and seasonal changes influenced by climate change, helping you understand the unique weather patterns of this region.
Temperature °C
| Month | ⌀ 1940 - 1950 | ⌀ 2013 - 2023 | +/- |
|---|---|---|---|
| Jan | -2.15 | -1.65 | 0.50 |
| Feb | -2.18 | -1.22 | 0.97 |
| Mar | 2.33 | 2.10 | -0.23 |
| Apr | 7.44 | 8.19 | 0.74 |
| May | 13.20 | 14.49 | 1.28 |
| Jun | 18.41 | 19.58 | 1.17 |
| Jul | 21.72 | 23.40 | 1.68 |
| Aug | 21.01 | 22.57 | 1.55 |
| Sep | 17.52 | 18.73 | 1.21 |
| Oct | 12.43 | 12.87 | 0.44 |
| Nov | 6.97 | 5.90 | -1.07 |
| Dec | 0.28 | 1.63 | 1.36 |
| ⌀ Month | 9.75 | 10.55 | 0.80 |
Sunshine (h)
| Month | ⌀ 1940 - 1950 | ⌀ 2013 - 2023 | +/- |
|---|---|---|---|
| Jan | 5.83 | 5.66 | -0.16 |
| Feb | 7.24 | 6.32 | -0.93 |
| Mar | 8.22 | 7.69 | -0.53 |
| Apr | 8.95 | 8.42 | -0.53 |
| May | 9.10 | 9.83 | 0.73 |
| Jun | 10.52 | 10.75 | 0.23 |
| Jul | 10.68 | 11.01 | 0.32 |
| Aug | 10.57 | 10.43 | -0.13 |
| Sep | 8.97 | 8.67 | -0.30 |
| Oct | 7.83 | 6.93 | -0.90 |
| Nov | 6.02 | 6.19 | 0.17 |
| Dec | 5.99 | 5.07 | -0.92 |
| ⌀ Month | 8.33 | 8.08 | -0.25 |
Rain (mm)
| Month | ⌀ 1940 - 1950 | ⌀ 2013 - 2023 | +/- |
|---|---|---|---|
| Jan | 1.67 | 1.88 | 0.22 |
| Feb | 1.52 | 1.73 | 0.21 |
| Mar | 2.21 | 2.08 | -0.13 |
| Apr | 3.06 | 3.15 | 0.10 |
| May | 3.05 | 2.35 | -0.70 |
| Jun | 2.95 | 3.20 | 0.25 |
| Jul | 2.69 | 3.67 | 0.98 |
| Aug | 2.11 | 2.42 | 0.32 |
| Sep | 2.14 | 3.29 | 1.15 |
| Oct | 2.42 | 3.82 | 1.40 |
| Nov | 3.86 | 2.84 | -1.02 |
| Dec | 2.28 | 3.28 | 1.00 |
| ⌀ Month | 2.50 | 2.81 | 0.31 |
Snow (mm)
| Month | ⌀ 1940 - 1950 | ⌀ 2013 - 2023 | +/- |
|---|---|---|---|
| Jan | 0.96 | 0.77 | -0.19 |
| Feb | 1.11 | 1.32 | 0.22 |
| Mar | 0.56 | 0.76 | 0.21 |
| Apr | 0.08 | 0.19 | 0.11 |
| May | 0.00 | 0.00 | -0.00 |
| Jun | 0.00 | 0.00 | 0.00 |
| Jul | 0.00 | 0.00 | 0.00 |
| Aug | 0.00 | 0.00 | 0.00 |
| Sep | 0.00 | 0.00 | 0.00 |
| Oct | 0.00 | 0.02 | 0.02 |
| Nov | 0.11 | 0.10 | -0.02 |
| Dec | 0.45 | 0.44 | -0.01 |
| ⌀ Month | 0.27 | 0.30 | 0.03 |