Climate Change Chart of Bordeaux, France
Comprehensive Climate Change Chart of Bordeaux, France: Monthly Averages and Impact Trends
Exploring the climate change data in Bordeaux, France reveals interesting insights into temperature, rainfall, snowfall, and sunshine duration trends over the years.
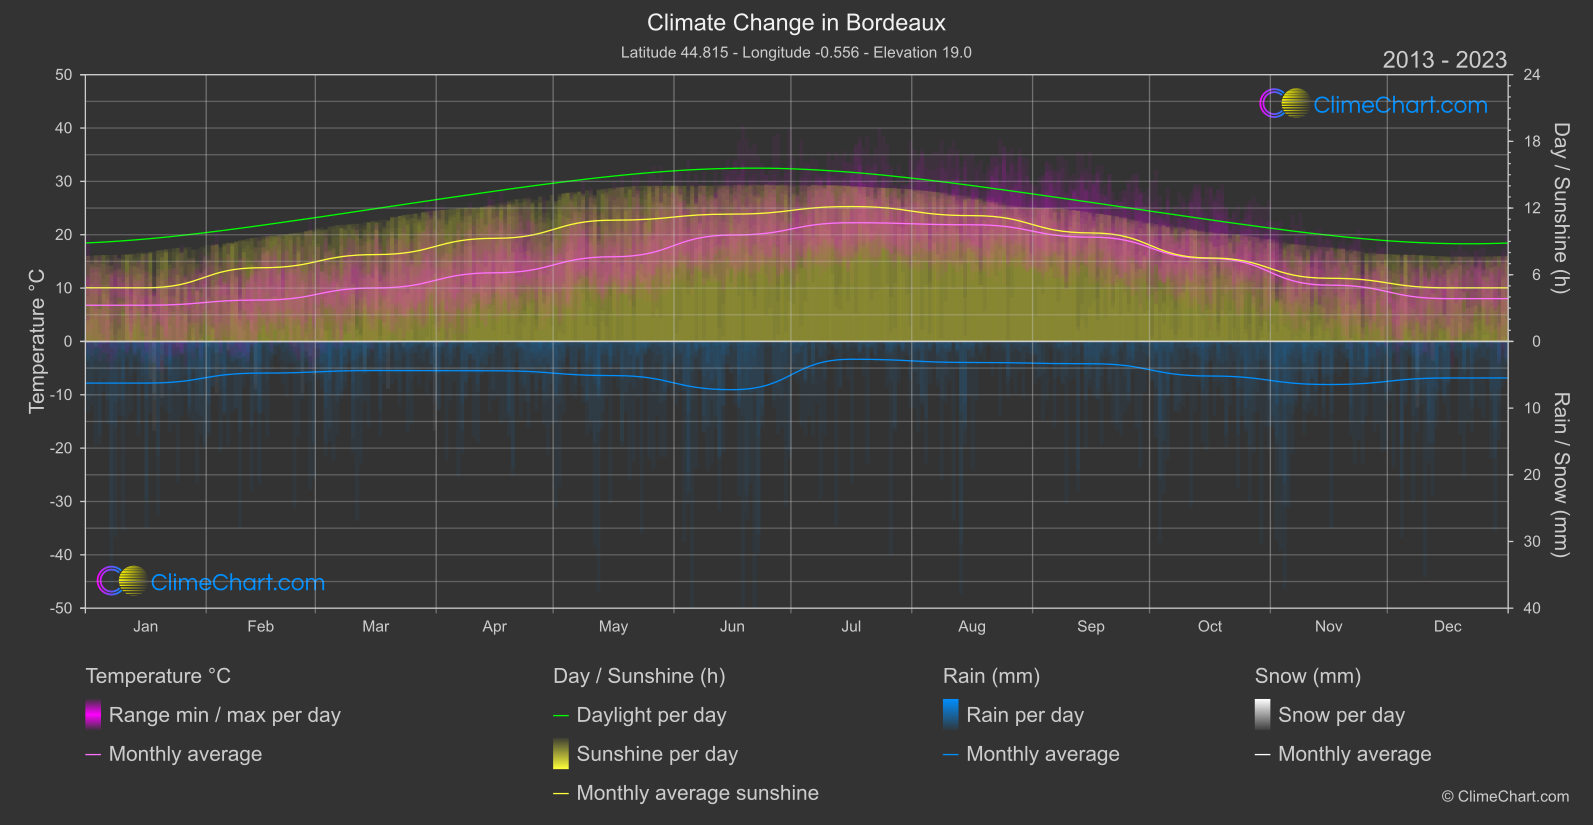
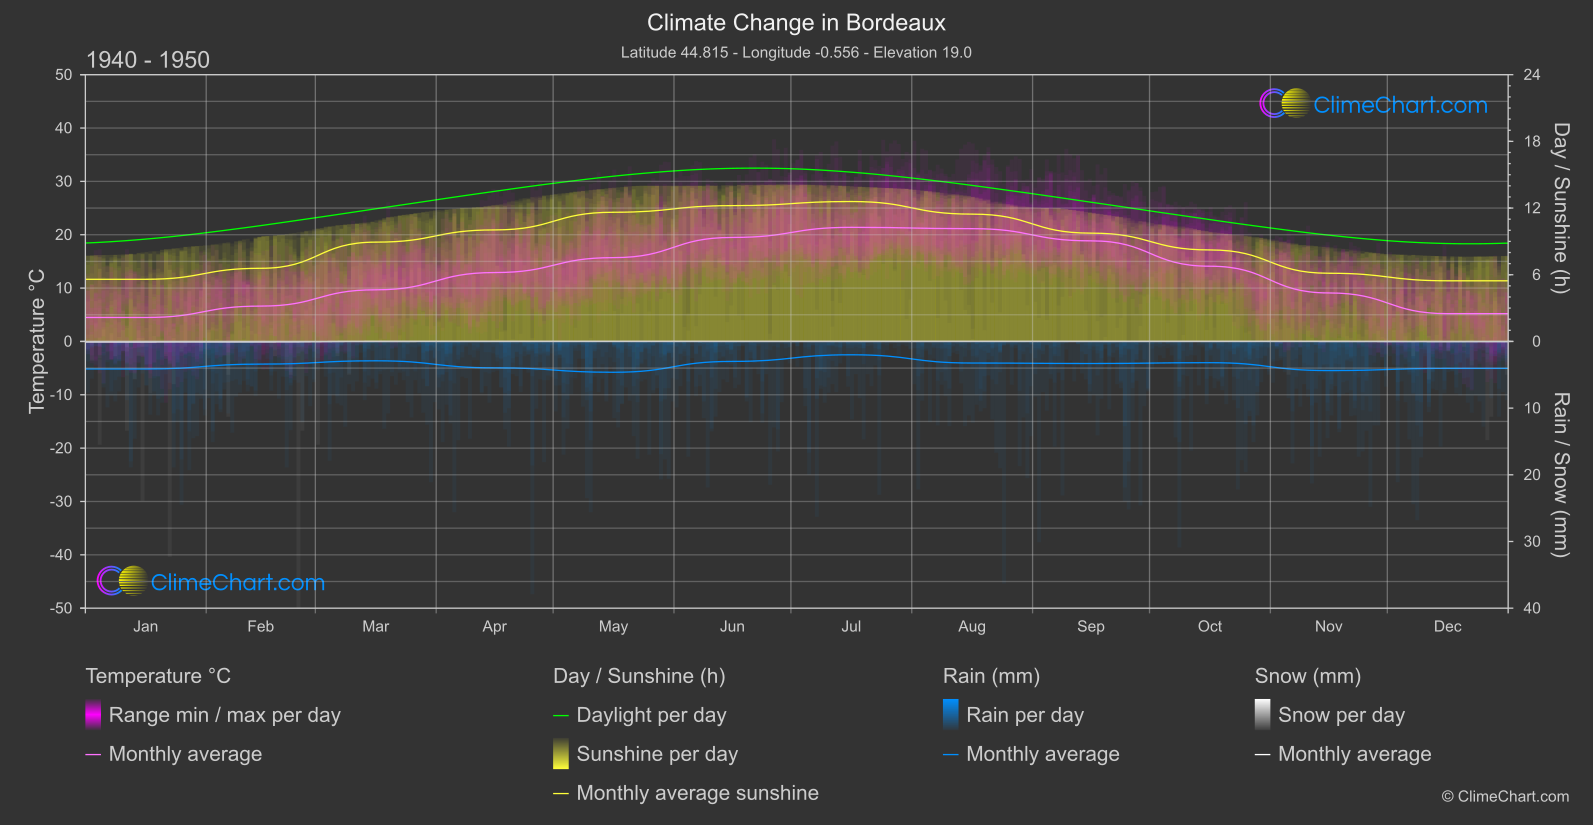
Bordeaux, a region known for its wine, is also experiencing notable changes in its climate. Analysis of the data from 1940 to 1950 compared to 2013 to 2024 shows a general increase in temperatures across most months, with the highest temperature change occurring in December. Rainfall patterns have also shifted, with varying changes in different months. Interestingly, snowfall has decreased significantly in many months, reflecting the impact of climate change. The sunshine duration has shown fluctuations, indicating shifts in weather patterns affecting sunlight exposure.
Climate Change Data Overview for Bordeaux, France
Explore the comprehensive climate change data for Bordeaux, France. This detailed table provides valuable insights into temperature variations, precipitation levels, and seasonal changes influenced by climate change, helping you understand the unique weather patterns of this region.
Temperature °C
| Month | ⌀ 1940 - 1950 | ⌀ 2013 - 2023 | +/- |
|---|---|---|---|
| Jan | 4.49 | 6.79 | 2.30 |
| Feb | 6.62 | 7.76 | 1.14 |
| Mar | 9.68 | 10.03 | 0.35 |
| Apr | 12.91 | 12.86 | -0.05 |
| May | 15.71 | 15.88 | 0.17 |
| Jun | 19.49 | 19.94 | 0.45 |
| Jul | 21.39 | 22.25 | 0.86 |
| Aug | 21.14 | 21.86 | 0.72 |
| Sep | 18.85 | 19.55 | 0.70 |
| Oct | 14.10 | 15.54 | 1.44 |
| Nov | 9.09 | 10.56 | 1.47 |
| Dec | 5.21 | 8.02 | 2.82 |
| ⌀ Month | 13.22 | 14.25 | 1.03 |
Sunshine (h)
| Month | ⌀ 1940 - 1950 | ⌀ 2013 - 2023 | +/- |
|---|---|---|---|
| Jan | 5.59 | 4.83 | -0.76 |
| Feb | 6.58 | 6.63 | 0.05 |
| Mar | 8.93 | 7.81 | -1.12 |
| Apr | 10.03 | 9.28 | -0.76 |
| May | 11.62 | 10.91 | -0.71 |
| Jun | 12.22 | 11.46 | -0.76 |
| Jul | 12.59 | 12.13 | -0.45 |
| Aug | 11.45 | 11.32 | -0.13 |
| Sep | 9.74 | 9.76 | 0.02 |
| Oct | 8.23 | 7.51 | -0.72 |
| Nov | 6.13 | 5.68 | -0.45 |
| Dec | 5.46 | 4.82 | -0.63 |
| ⌀ Month | 9.05 | 8.51 | -0.54 |
Rain (mm)
| Month | ⌀ 1940 - 1950 | ⌀ 2013 - 2023 | +/- |
|---|---|---|---|
| Jan | 2.06 | 3.12 | 1.06 |
| Feb | 1.70 | 2.37 | 0.67 |
| Mar | 1.45 | 2.18 | 0.73 |
| Apr | 1.98 | 2.20 | 0.22 |
| May | 2.31 | 2.56 | 0.25 |
| Jun | 1.50 | 3.62 | 2.12 |
| Jul | 1.00 | 1.34 | 0.33 |
| Aug | 1.62 | 1.58 | -0.04 |
| Sep | 1.66 | 1.67 | 0.02 |
| Oct | 1.59 | 2.59 | 1.00 |
| Nov | 2.18 | 3.23 | 1.05 |
| Dec | 2.02 | 2.74 | 0.72 |
| ⌀ Month | 1.76 | 2.43 | 0.68 |
Snow (mm)
| Month | ⌀ 1940 - 1950 | ⌀ 2013 - 2023 | +/- |
|---|---|---|---|
| Jan | 0.04 | 0.01 | -0.03 |
| Feb | 0.03 | 0.01 | -0.02 |
| Mar | 0.00 | 0.01 | 0.01 |
| Apr | 0.00 | 0.00 | 0.00 |
| May | 0.00 | 0.00 | 0.00 |
| Jun | 0.00 | 0.00 | 0.00 |
| Jul | 0.00 | 0.00 | 0.00 |
| Aug | 0.00 | 0.00 | 0.00 |
| Sep | 0.00 | 0.00 | 0.00 |
| Oct | 0.00 | 0.00 | 0.00 |
| Nov | 0.00 | 0.00 | -0.00 |
| Dec | 0.01 | 0.00 | -0.01 |
| ⌀ Month | 0.01 | 0.00 | -0.00 |