Climate Change Chart of Bologna, Italy
Comprehensive Climate Change Chart of Bologna, Italy: Monthly Averages and Impact Trends
Explore the changing climate in Bologna, Italy with insights from temperature, rainfall, snowfall, and sunshine duration data.
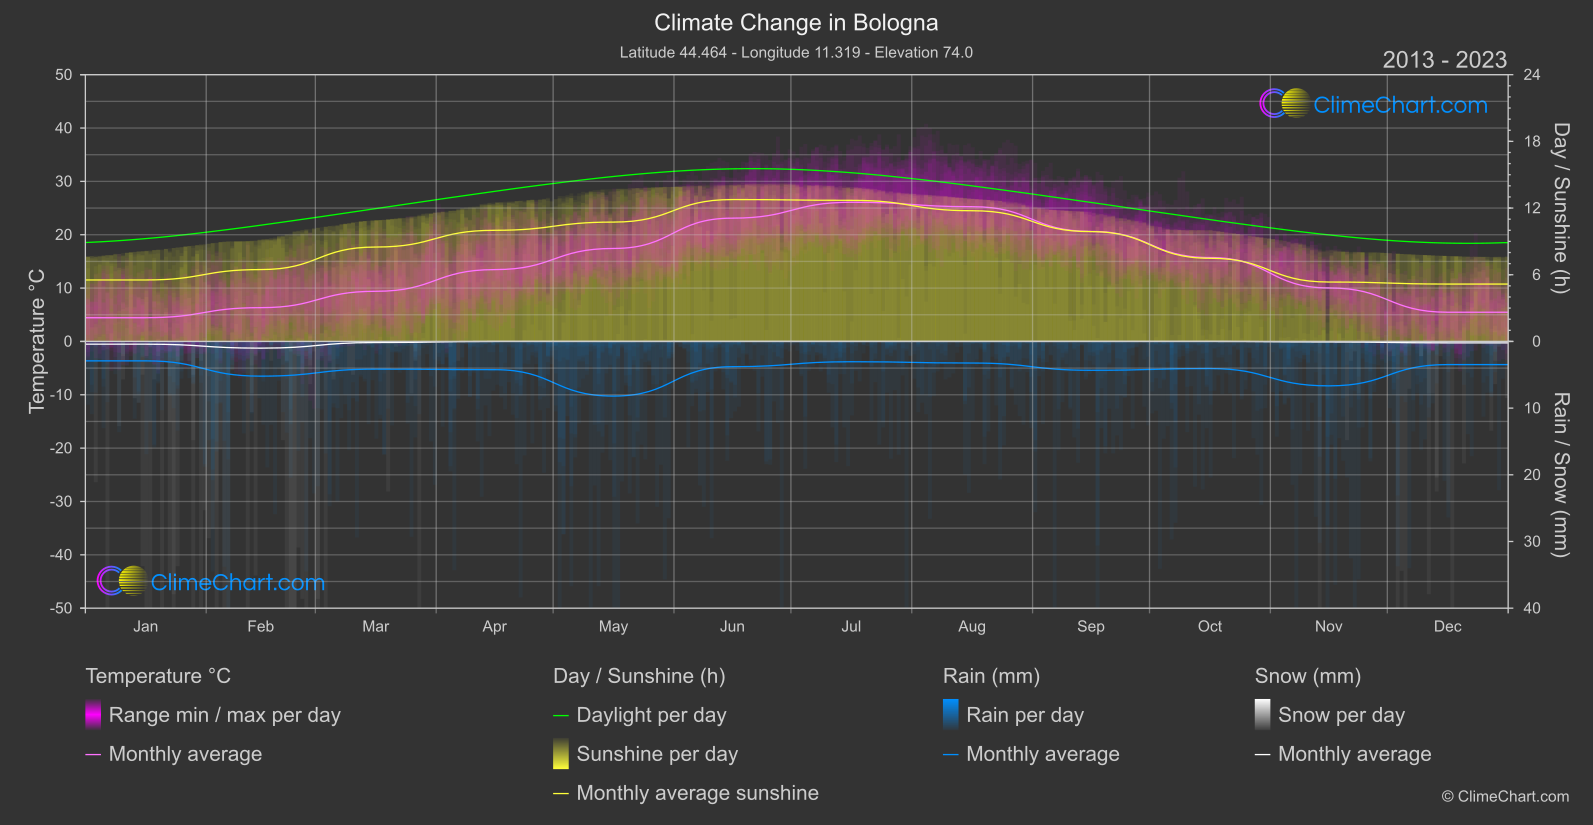
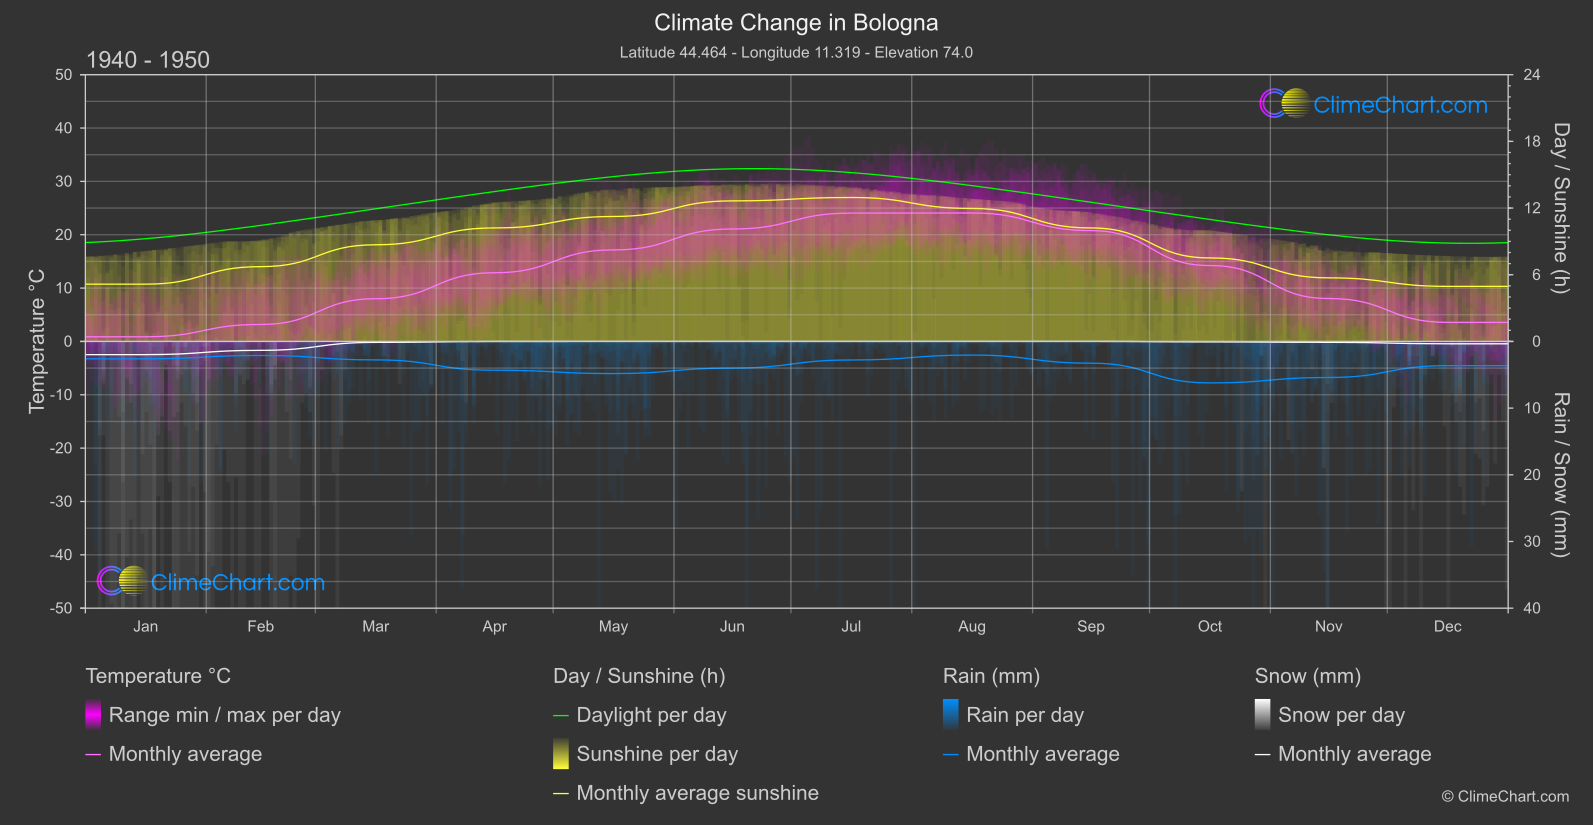
Discover detailed insights about the climate and weather patterns in Bologna, Italy based on temperature, rainfall, snowfall, and sunshine duration data. The data compares the period between 1940 - 1950 to 2013 - 2024. For example, the month of July shows a temperature increase of 2.03°C compared to historical records, indicating a significant trend in warming. Additionally, the month with the highest change in rainfall is October, with a decrease of 1.08 mm. Explore further to understand the evolving climate trends in Bologna.
Climate Change Data Overview for Bologna, Italy
Explore the comprehensive climate change data for Bologna, Italy. This detailed table provides valuable insights into temperature variations, precipitation levels, and seasonal changes influenced by climate change, helping you understand the unique weather patterns of this region.
Temperature °C
| Month | ⌀ 1940 - 1950 | ⌀ 2013 - 2023 | +/- |
|---|---|---|---|
| Jan | 0.88 | 4.44 | 3.57 |
| Feb | 3.18 | 6.33 | 3.15 |
| Mar | 8.00 | 9.40 | 1.40 |
| Apr | 12.87 | 13.46 | 0.59 |
| May | 17.15 | 17.43 | 0.27 |
| Jun | 21.08 | 23.11 | 2.03 |
| Jul | 24.05 | 26.09 | 2.03 |
| Aug | 24.08 | 25.26 | 1.18 |
| Sep | 20.78 | 20.62 | -0.16 |
| Oct | 14.22 | 15.72 | 1.50 |
| Nov | 8.04 | 10.03 | 1.98 |
| Dec | 3.57 | 5.47 | 1.90 |
| ⌀ Month | 13.16 | 14.78 | 1.62 |
Sunshine (h)
| Month | ⌀ 1940 - 1950 | ⌀ 2013 - 2023 | +/- |
|---|---|---|---|
| Jan | 5.15 | 5.53 | 0.38 |
| Feb | 6.73 | 6.47 | -0.26 |
| Mar | 8.70 | 8.49 | -0.20 |
| Apr | 10.21 | 10.00 | -0.21 |
| May | 11.24 | 10.74 | -0.50 |
| Jun | 12.65 | 12.76 | 0.12 |
| Jul | 12.95 | 12.70 | -0.26 |
| Aug | 11.96 | 11.76 | -0.20 |
| Sep | 10.21 | 9.88 | -0.33 |
| Oct | 7.51 | 7.48 | -0.03 |
| Nov | 5.72 | 5.35 | -0.37 |
| Dec | 4.95 | 5.16 | 0.21 |
| ⌀ Month | 9.00 | 8.86 | -0.14 |
Rain (mm)
| Month | ⌀ 1940 - 1950 | ⌀ 2013 - 2023 | +/- |
|---|---|---|---|
| Jan | 1.30 | 1.46 | 0.15 |
| Feb | 1.05 | 2.60 | 1.55 |
| Mar | 1.38 | 2.08 | 0.69 |
| Apr | 2.16 | 2.12 | -0.04 |
| May | 2.41 | 4.10 | 1.69 |
| Jun | 2.00 | 1.89 | -0.10 |
| Jul | 1.39 | 1.52 | 0.13 |
| Aug | 1.02 | 1.62 | 0.60 |
| Sep | 1.63 | 2.16 | 0.53 |
| Oct | 3.11 | 2.03 | -1.08 |
| Nov | 2.70 | 3.33 | 0.63 |
| Dec | 1.81 | 1.74 | -0.08 |
| ⌀ Month | 1.83 | 2.22 | 0.39 |
Snow (mm)
| Month | ⌀ 1940 - 1950 | ⌀ 2013 - 2023 | +/- |
|---|---|---|---|
| Jan | 0.99 | 0.21 | -0.78 |
| Feb | 0.67 | 0.50 | -0.16 |
| Mar | 0.07 | 0.08 | 0.01 |
| Apr | 0.00 | 0.00 | -0.00 |
| May | 0.00 | 0.00 | 0.00 |
| Jun | 0.00 | 0.00 | 0.00 |
| Jul | 0.00 | 0.00 | 0.00 |
| Aug | 0.00 | 0.00 | 0.00 |
| Sep | 0.00 | 0.00 | 0.00 |
| Oct | 0.03 | 0.00 | -0.03 |
| Nov | 0.07 | 0.04 | -0.03 |
| Dec | 0.18 | 0.11 | -0.07 |
| ⌀ Month | 0.17 | 0.08 | -0.09 |