Climate Change Chart of Bismarck, USA
Comprehensive Climate Change Chart of Bismarck, USA: Monthly Averages and Impact Trends
Explore the changing climate in Bismarck, USA with insights on temperature, rainfall, snowfall, and sunshine duration. Discover how the climate has evolved from 1940 - 1950 to 2013 - 2024.
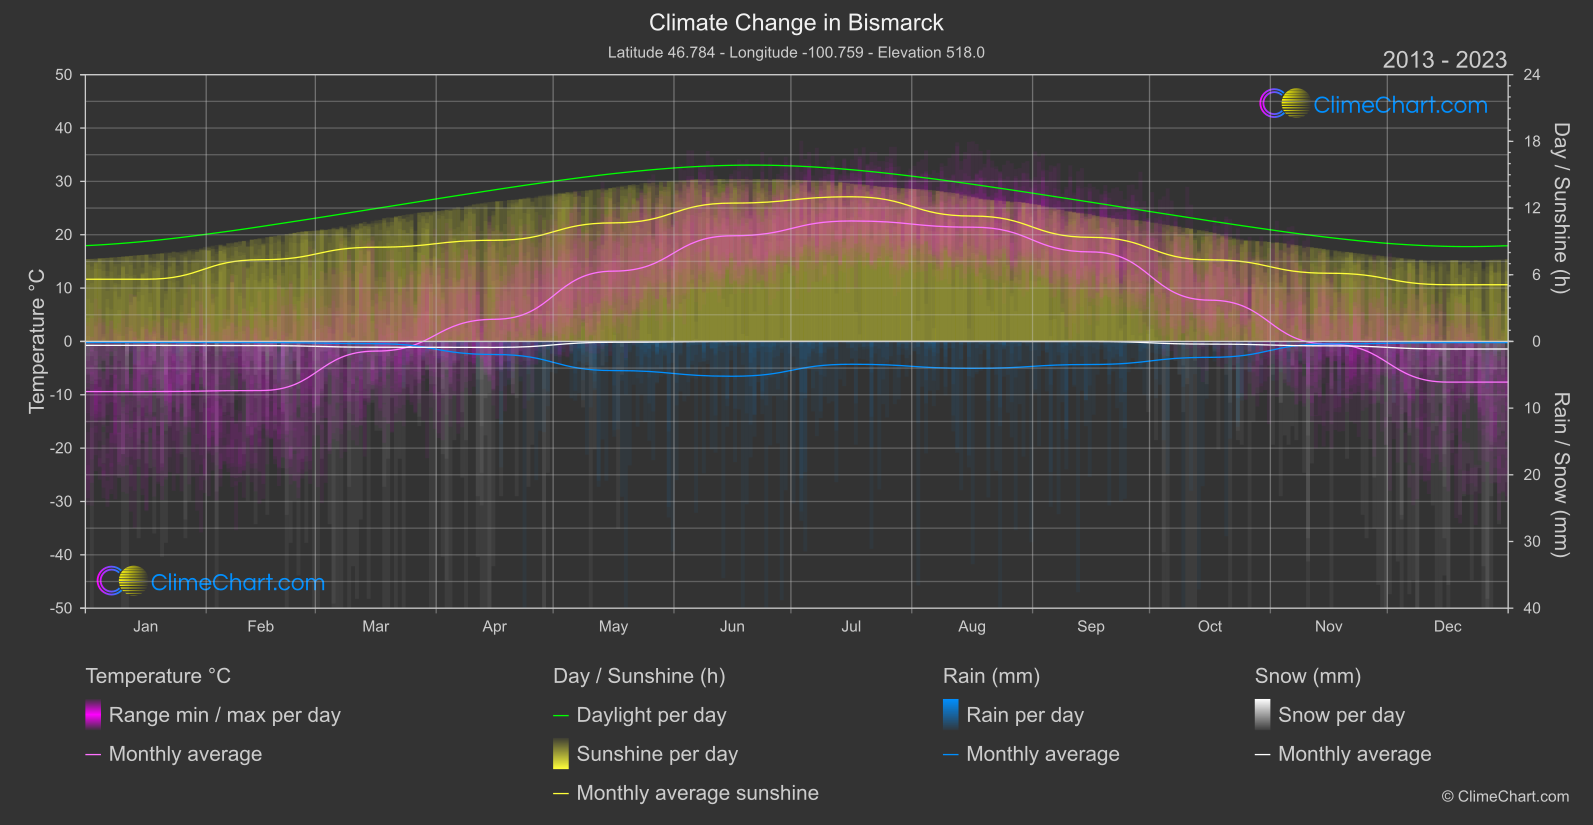
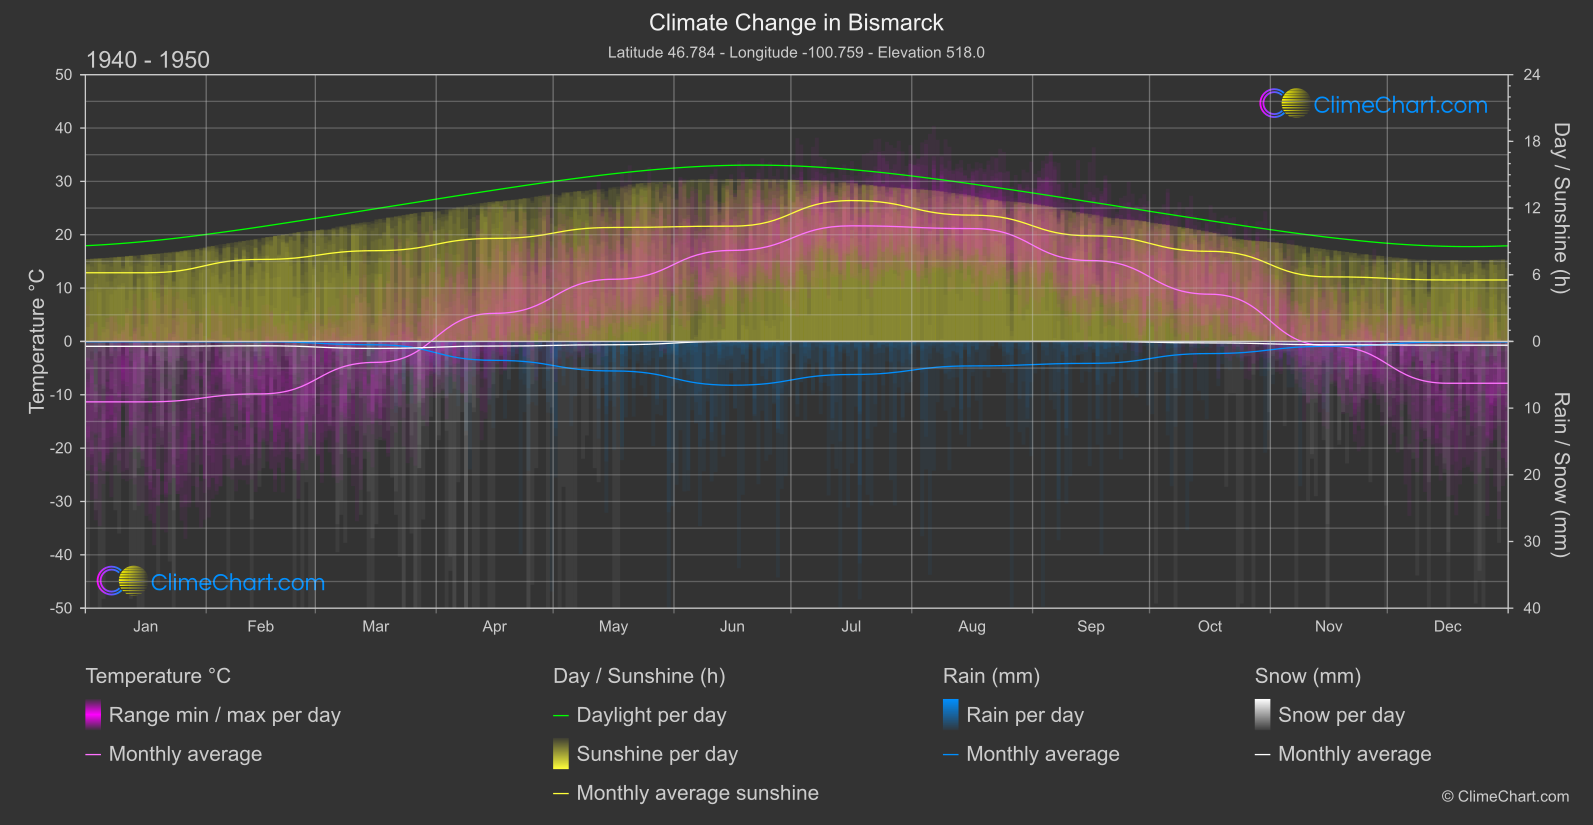
Bismarck, USA has experienced notable changes in climate over the years. From January to June, temperatures have increased by varying degrees, with June showing the highest temperature change. Conversely, rainfall patterns have fluctuated, with July experiencing the most significant decrease in rainfall compared to the past. Snowfall in Bismarck has generally decreased over the years, with December showing the most notable increase in snowfall. Sunshine duration has seen fluctuations, with June having the highest increase in sunshine hours compared to the past. These insights shed light on the evolving climate trends in Bismarck, USA.
Climate Change Data Overview for Bismarck, USA
Explore the comprehensive climate change data for Bismarck, USA. This detailed table provides valuable insights into temperature variations, precipitation levels, and seasonal changes influenced by climate change, helping you understand the unique weather patterns of this region.
Temperature °C
| Month | ⌀ 1940 - 1950 | ⌀ 2013 - 2023 | +/- |
|---|---|---|---|
| Jan | -11.33 | -9.40 | 1.93 |
| Feb | -9.83 | -9.21 | 0.63 |
| Mar | -3.93 | -1.81 | 2.12 |
| Apr | 5.26 | 4.15 | -1.11 |
| May | 11.65 | 13.18 | 1.52 |
| Jun | 17.06 | 19.81 | 2.75 |
| Jul | 21.67 | 22.58 | 0.91 |
| Aug | 21.15 | 21.42 | 0.27 |
| Sep | 15.16 | 16.78 | 1.62 |
| Oct | 8.85 | 7.73 | -1.12 |
| Nov | -0.85 | -0.50 | 0.35 |
| Dec | -7.84 | -7.63 | 0.21 |
| ⌀ Month | 5.59 | 6.43 | 0.84 |
Sunshine (h)
| Month | ⌀ 1940 - 1950 | ⌀ 2013 - 2023 | +/- |
|---|---|---|---|
| Jan | 6.18 | 5.60 | -0.58 |
| Feb | 7.38 | 7.35 | -0.03 |
| Mar | 8.17 | 8.48 | 0.31 |
| Apr | 9.27 | 9.10 | -0.17 |
| May | 10.25 | 10.67 | 0.41 |
| Jun | 10.37 | 12.45 | 2.07 |
| Jul | 12.67 | 13.01 | 0.34 |
| Aug | 11.36 | 11.28 | -0.08 |
| Sep | 9.50 | 9.37 | -0.14 |
| Oct | 8.11 | 7.34 | -0.76 |
| Nov | 5.81 | 6.13 | 0.32 |
| Dec | 5.53 | 5.10 | -0.43 |
| ⌀ Month | 8.72 | 8.82 | 0.11 |
Rain (mm)
| Month | ⌀ 1940 - 1950 | ⌀ 2013 - 2023 | +/- |
|---|---|---|---|
| Jan | 0.02 | 0.08 | 0.06 |
| Feb | 0.02 | 0.08 | 0.06 |
| Mar | 0.25 | 0.17 | -0.08 |
| Apr | 1.42 | 0.98 | -0.44 |
| May | 2.21 | 2.19 | -0.03 |
| Jun | 3.28 | 2.61 | -0.67 |
| Jul | 2.48 | 1.71 | -0.77 |
| Aug | 1.84 | 2.02 | 0.18 |
| Sep | 1.64 | 1.73 | 0.08 |
| Oct | 0.91 | 1.19 | 0.28 |
| Nov | 0.37 | 0.19 | -0.18 |
| Dec | 0.04 | 0.09 | 0.05 |
| ⌀ Month | 1.21 | 1.09 | -0.12 |
Snow (mm)
| Month | ⌀ 1940 - 1950 | ⌀ 2013 - 2023 | +/- |
|---|---|---|---|
| Jan | 0.37 | 0.29 | -0.07 |
| Feb | 0.33 | 0.31 | -0.01 |
| Mar | 0.52 | 0.43 | -0.09 |
| Apr | 0.35 | 0.45 | 0.10 |
| May | 0.25 | 0.06 | -0.19 |
| Jun | 0.00 | 0.00 | 0.00 |
| Jul | 0.00 | 0.00 | 0.00 |
| Aug | 0.00 | 0.00 | 0.00 |
| Sep | 0.00 | 0.00 | 0.00 |
| Oct | 0.11 | 0.20 | 0.09 |
| Nov | 0.25 | 0.33 | 0.08 |
| Dec | 0.28 | 0.57 | 0.29 |
| ⌀ Month | 0.20 | 0.22 | 0.02 |