Climate Change Chart of Birmingham, Great Britain
Comprehensive Climate Change Chart of Birmingham, Great Britain: Monthly Averages and Impact Trends
Explore the changing climate in Birmingham, United Kingdom, with insightful data analysis on temperature, rainfall, snowfall, and sunshine duration.
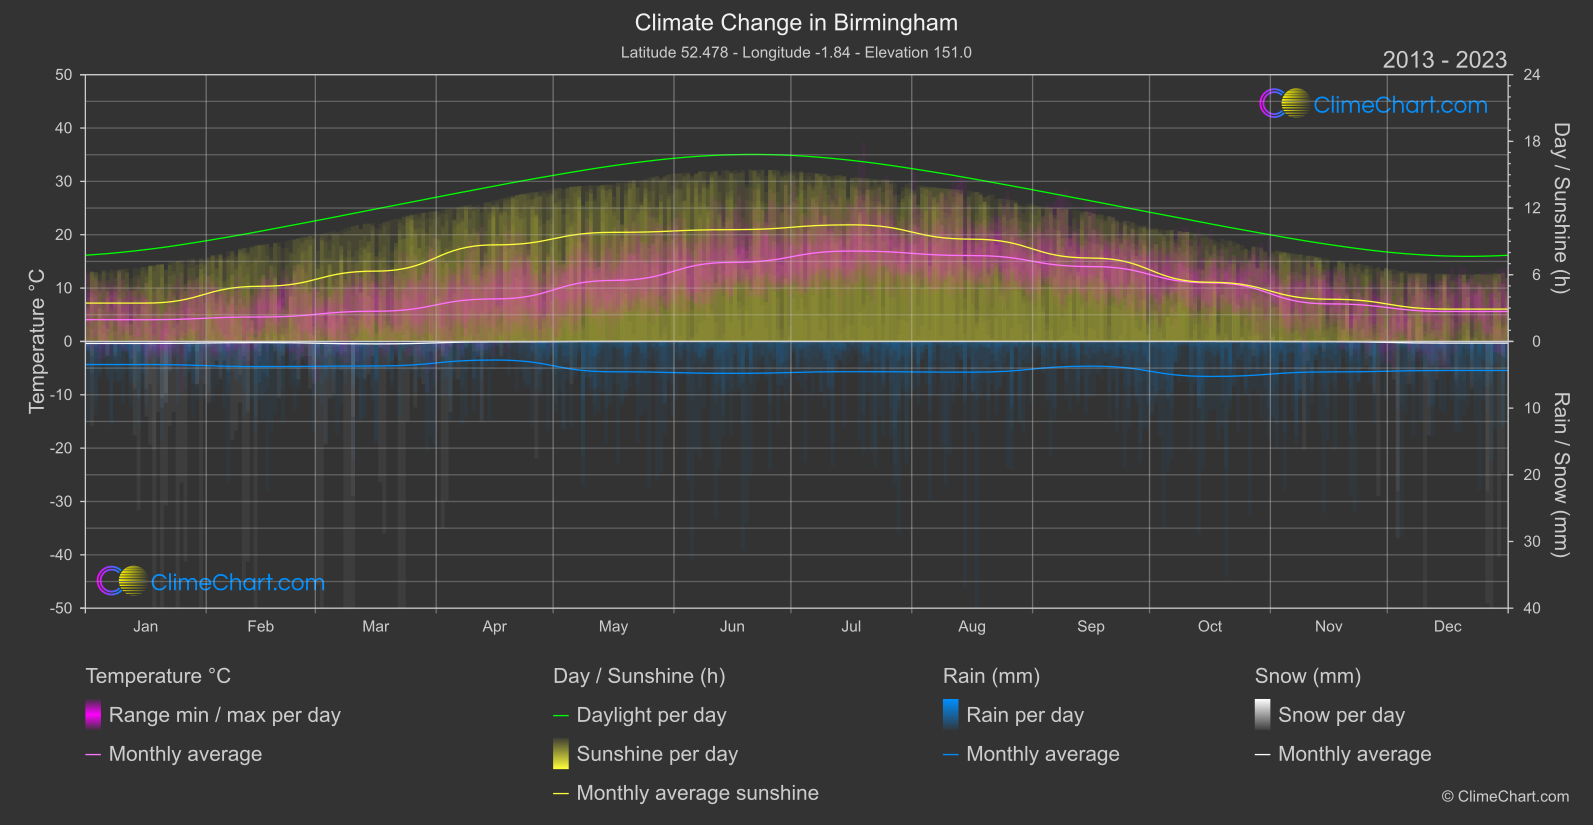
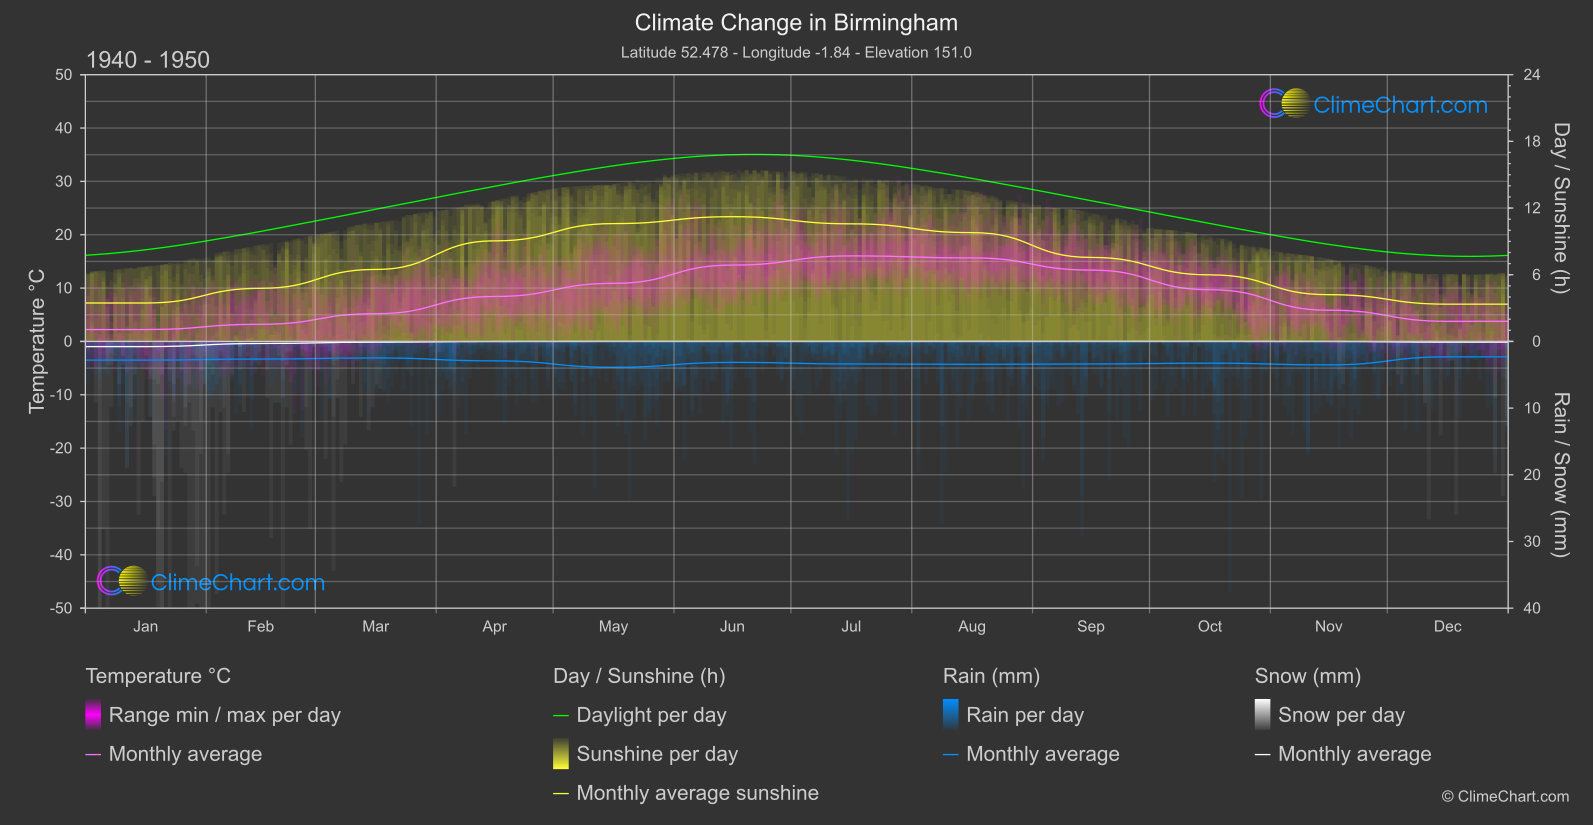
Birmingham, located in the United Kingdom, has experienced notable changes in climate over the years. Analyzing the data from 1940 to 1950 compared to 2013 to 2024, we observe varying trends in temperature, rainfall, snowfall, and sunshine duration. The month with the highest change in temperature is typically November, while December sees the most significant increase in rainfall. Snowfall remains minimal throughout the years, with no significant changes observed. Sunshine duration shows a decreasing trend across the months, with June experiencing the most substantial decrease.
Climate Change Data Overview for Birmingham, Great Britain
Explore the comprehensive climate change data for Birmingham, Great Britain. This detailed table provides valuable insights into temperature variations, precipitation levels, and seasonal changes influenced by climate change, helping you understand the unique weather patterns of this region.
Temperature °C
| Month | ⌀ 1940 - 1950 | ⌀ 2013 - 2023 | +/- |
|---|---|---|---|
| Jan | 2.23 | 4.07 | 1.85 |
| Feb | 3.22 | 4.58 | 1.37 |
| Mar | 5.20 | 5.67 | 0.47 |
| Apr | 8.43 | 7.97 | -0.46 |
| May | 10.89 | 11.44 | 0.55 |
| Jun | 14.31 | 14.82 | 0.51 |
| Jul | 16.03 | 16.94 | 0.91 |
| Aug | 15.65 | 16.09 | 0.44 |
| Sep | 13.38 | 14.03 | 0.66 |
| Oct | 9.69 | 10.99 | 1.30 |
| Nov | 5.85 | 7.04 | 1.19 |
| Dec | 3.77 | 5.61 | 1.85 |
| ⌀ Month | 9.05 | 9.94 | 0.89 |
Sunshine (h)
| Month | ⌀ 1940 - 1950 | ⌀ 2013 - 2023 | +/- |
|---|---|---|---|
| Jan | 3.46 | 3.45 | -0.01 |
| Feb | 4.78 | 4.96 | 0.18 |
| Mar | 6.48 | 6.33 | -0.15 |
| Apr | 9.05 | 8.69 | -0.36 |
| May | 10.60 | 9.81 | -0.79 |
| Jun | 11.22 | 10.06 | -1.17 |
| Jul | 10.58 | 10.49 | -0.09 |
| Aug | 9.79 | 9.20 | -0.59 |
| Sep | 7.56 | 7.50 | -0.06 |
| Oct | 5.99 | 5.32 | -0.66 |
| Nov | 4.21 | 3.80 | -0.41 |
| Dec | 3.35 | 2.91 | -0.44 |
| ⌀ Month | 7.26 | 6.88 | -0.38 |
Rain (mm)
| Month | ⌀ 1940 - 1950 | ⌀ 2013 - 2023 | +/- |
|---|---|---|---|
| Jan | 1.40 | 1.73 | 0.33 |
| Feb | 1.32 | 1.88 | 0.56 |
| Mar | 1.24 | 1.84 | 0.60 |
| Apr | 1.46 | 1.39 | -0.06 |
| May | 1.94 | 2.28 | 0.34 |
| Jun | 1.57 | 2.39 | 0.82 |
| Jul | 1.69 | 2.27 | 0.58 |
| Aug | 1.72 | 2.30 | 0.59 |
| Sep | 1.69 | 1.85 | 0.16 |
| Oct | 1.63 | 2.62 | 0.99 |
| Nov | 1.76 | 2.29 | 0.53 |
| Dec | 1.16 | 2.18 | 1.02 |
| ⌀ Month | 1.55 | 2.09 | 0.54 |
Snow (mm)
| Month | ⌀ 1940 - 1950 | ⌀ 2013 - 2023 | +/- |
|---|---|---|---|
| Jan | 0.39 | 0.15 | -0.24 |
| Feb | 0.15 | 0.09 | -0.07 |
| Mar | 0.06 | 0.18 | 0.13 |
| Apr | 0.01 | 0.03 | 0.03 |
| May | 0.00 | 0.00 | 0.00 |
| Jun | 0.00 | 0.00 | 0.00 |
| Jul | 0.00 | 0.00 | 0.00 |
| Aug | 0.00 | 0.00 | 0.00 |
| Sep | 0.00 | 0.00 | 0.00 |
| Oct | 0.00 | 0.00 | 0.00 |
| Nov | 0.00 | 0.02 | 0.01 |
| Dec | 0.06 | 0.13 | 0.07 |
| ⌀ Month | 0.06 | 0.05 | -0.01 |