Climate Change Chart of Big Sky Ski-Resort, USA
Comprehensive Climate Change Chart of Big Sky Ski-Resort, USA: Monthly Averages and Impact Trends
For Big Sky Ski-Resort, USA, the climate data compare 1940–1950 with 2013–2023.
Mean daily snowfall increased by +1.12 mm/day when the monthly means are averaged across calendar months; this unweighted summary is not a day-weighted annual average or a monthly total. The largest monthly increase was in December, at a difference of +3.51 mm/day.
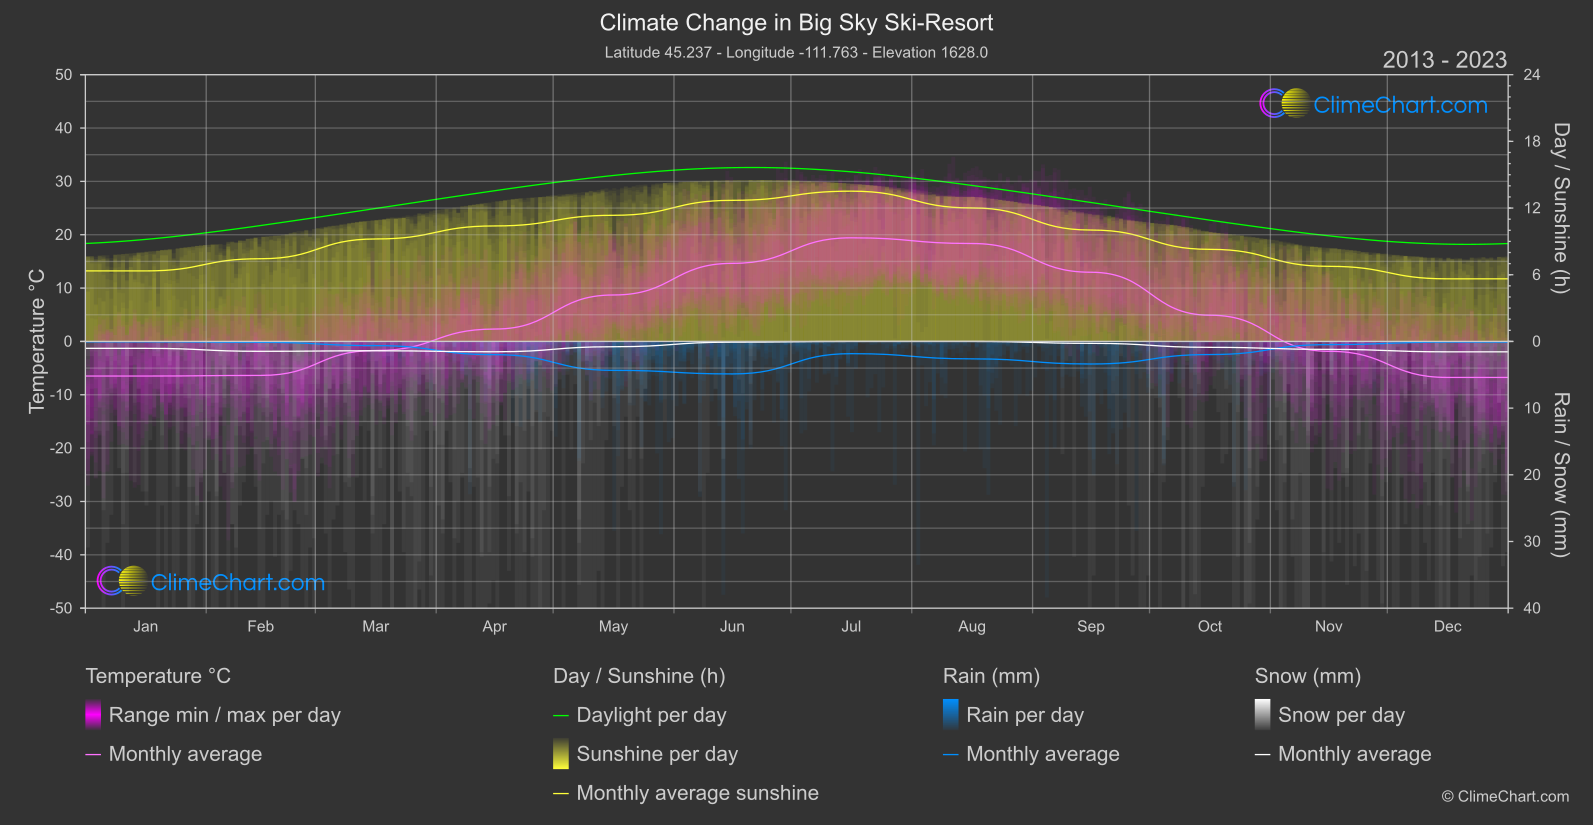
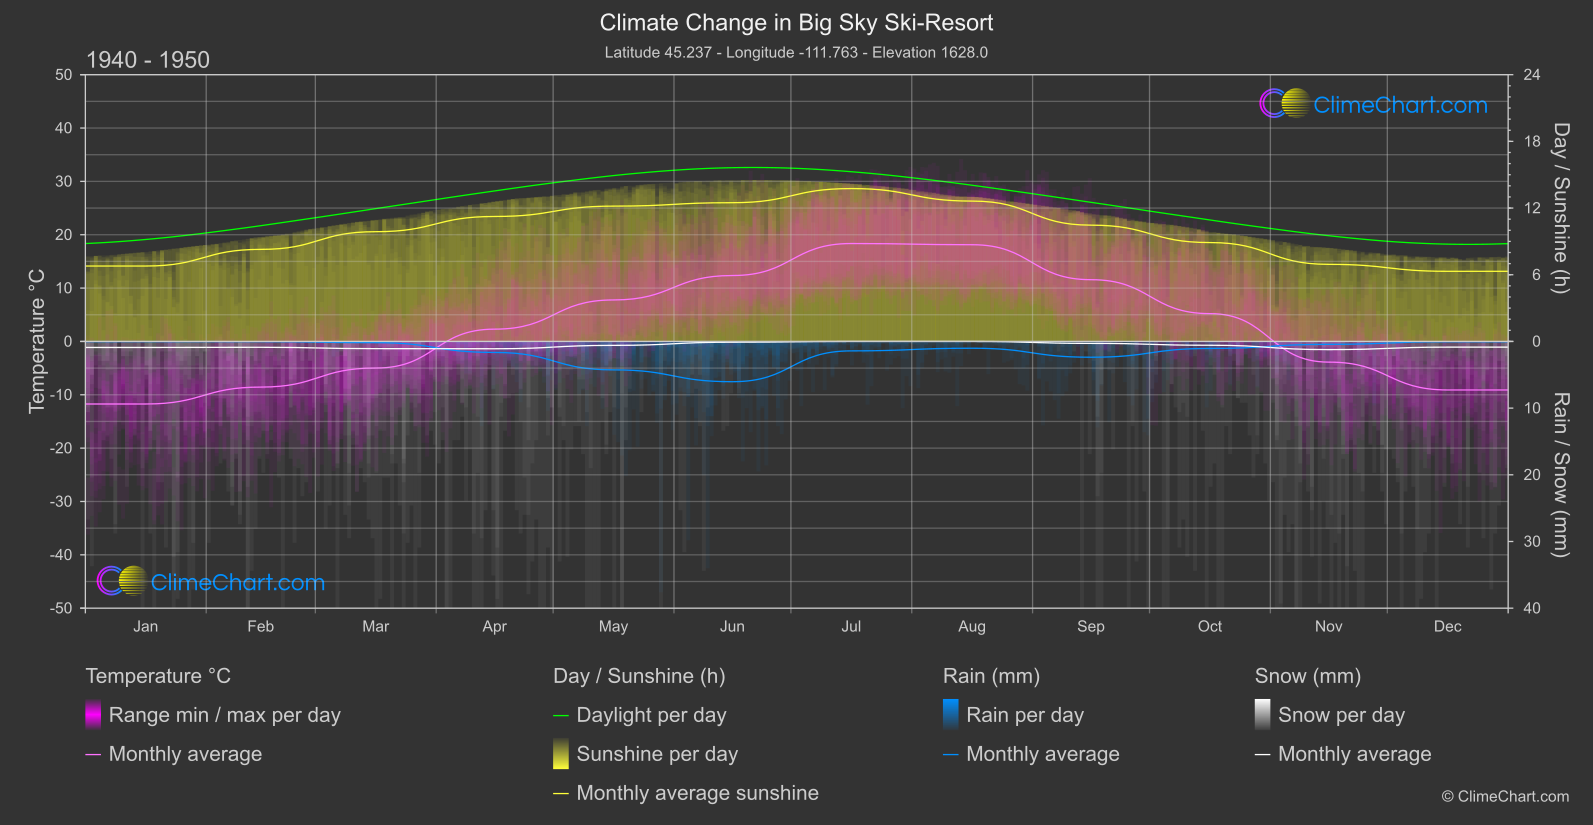
Overview of climate changes
Changes in snowfall
Mean daily snowfall increased by +1.12 mm/day when the monthly means are averaged across calendar months; this unweighted summary is not a day-weighted annual average or a monthly total. The largest monthly increase was in December, at a difference of +3.51 mm/day. By contrast, November had the largest monthly decrease, a difference of -0.16 mm/day. These period averages describe a broad monthly pattern and do not establish that the same change occurred in every month.
Temperature changes
The unweighted mean difference across calendar-month mean temperatures is an increase of +1.73 °C; this summarizes monthly means rather than daytime maximum temperatures and does not imply the same change in every month. The largest monthly increase was in January, at a difference of +5.24 °C. In contrast, October had the largest monthly decrease, a difference of -0.29 °C.
Changes in sunshine duration
Mean daily sunshine duration averaged across calendar months decreased by -0.51 hours/day. The largest monthly reduction was in April, where the difference was -0.85 hours/day; June went the other way, with the largest monthly increase of +0.21 hours/day. These are differences in monthly mean daily hours, not statements about every day or every month.
Changes in rainfall
Averaged across calendar months, mean daily rainfall increased by +0.16 mm/day. This is an unweighted comparison of monthly means, not a day-weighted annual average or a monthly total. The largest monthly increase occurred in August, with a difference of +0.80 mm/day, while June recorded the largest decrease, a difference of -0.58 mm/day. These monthly contrasts show why the overall mean should not be read as a uniform change through the year.
Climate Change Data Overview for Big Sky Ski-Resort, USA
Explore the comprehensive climate change data for Big Sky Ski-Resort, USA. This detailed table provides valuable insights into temperature variations, precipitation levels, and seasonal changes influenced by climate change, helping you understand the unique weather patterns of this region.
Temperature °C
| Month | ⌀ 1940 - 1950 | ⌀ 2013 - 2023 | +/- |
|---|---|---|---|
| Jan | -11.73 | -6.49 | 5.24 |
| Feb | -8.56 | -6.37 | 2.19 |
| Mar | -4.99 | -1.70 | 3.29 |
| Apr | 2.30 | 2.32 | 0.02 |
| May | 7.78 | 8.71 | 0.93 |
| Jun | 12.36 | 14.64 | 2.28 |
| Jul | 18.35 | 19.42 | 1.07 |
| Aug | 18.13 | 18.35 | 0.23 |
| Sep | 11.57 | 12.97 | 1.40 |
| Oct | 5.21 | 4.92 | -0.29 |
| Nov | -3.88 | -1.85 | 2.03 |
| Dec | -9.10 | -6.75 | 2.35 |
| ⌀ Month | 3.12 | 4.85 | 1.73 |
Sunshine (h) / day
| Month | ⌀ 1940 - 1950 | ⌀ 2013 - 2023 | +/- |
|---|---|---|---|
| Jan | 6.78 | 6.34 | -0.44 |
| Feb | 8.28 | 7.44 | -0.84 |
| Mar | 9.87 | 9.22 | -0.65 |
| Apr | 11.24 | 10.39 | -0.85 |
| May | 12.17 | 11.35 | -0.83 |
| Jun | 12.48 | 12.69 | 0.21 |
| Jul | 13.75 | 13.52 | -0.23 |
| Aug | 12.63 | 12.01 | -0.62 |
| Sep | 10.46 | 10.02 | -0.44 |
| Oct | 8.90 | 8.28 | -0.61 |
| Nov | 6.93 | 6.76 | -0.18 |
| Dec | 6.31 | 5.63 | -0.68 |
| ⌀ Month | 9.99 | 9.47 | -0.51 |
Rain (mm) / day
| Month | ⌀ 1940 - 1950 | ⌀ 2013 - 2023 | +/- |
|---|---|---|---|
| Jan | 0.01 | 0.03 | 0.02 |
| Feb | 0.01 | 0.07 | 0.05 |
| Mar | 0.09 | 0.31 | 0.22 |
| Apr | 0.83 | 0.99 | 0.17 |
| May | 2.13 | 2.17 | 0.04 |
| Jun | 3.02 | 2.44 | -0.58 |
| Jul | 0.71 | 0.92 | 0.21 |
| Aug | 0.51 | 1.31 | 0.80 |
| Sep | 1.18 | 1.69 | 0.51 |
| Oct | 0.53 | 0.98 | 0.46 |
| Nov | 0.22 | 0.24 | 0.02 |
| Dec | 0.02 | 0.05 | 0.03 |
| ⌀ Month | 0.77 | 0.93 | 0.16 |
Snow (mm) / day
| Month | ⌀ 1940 - 1950 | ⌀ 2013 - 2023 | +/- |
|---|---|---|---|
| Jan | 4.53 | 5.18 | 0.65 |
| Feb | 4.40 | 7.41 | 3.01 |
| Mar | 5.41 | 7.00 | 1.60 |
| Apr | 5.49 | 7.75 | 2.26 |
| May | 2.95 | 3.97 | 1.02 |
| Jun | 0.58 | 0.55 | -0.03 |
| Jul | 0.00 | 0.00 | 0.00 |
| Aug | 0.00 | 0.00 | 0.00 |
| Sep | 1.46 | 1.42 | -0.04 |
| Oct | 2.87 | 4.43 | 1.56 |
| Nov | 6.13 | 5.96 | -0.16 |
| Dec | 4.28 | 7.79 | 3.51 |
| ⌀ Month | 3.17 | 4.29 | 1.12 |