Climate Change Chart of Berlin, Germany
Comprehensive Climate Change Chart of Berlin, Germany: Monthly Averages and Impact Trends
Explore the changing climate in Berlin, Germany, with insights from data analysis. Discover how temperatures, rainfall, snowfall, and sunshine duration have evolved over time.
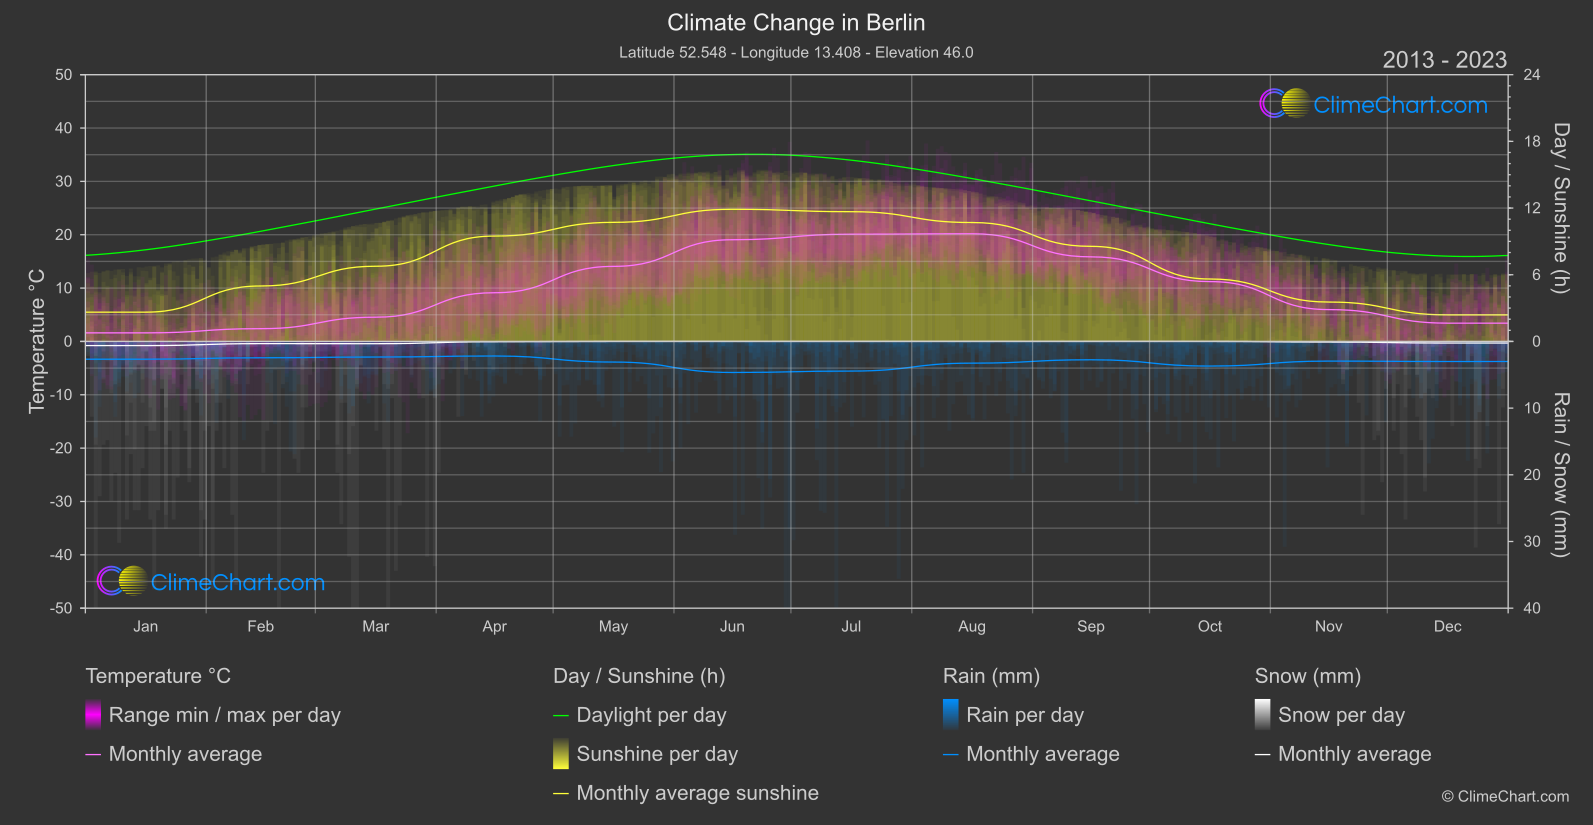
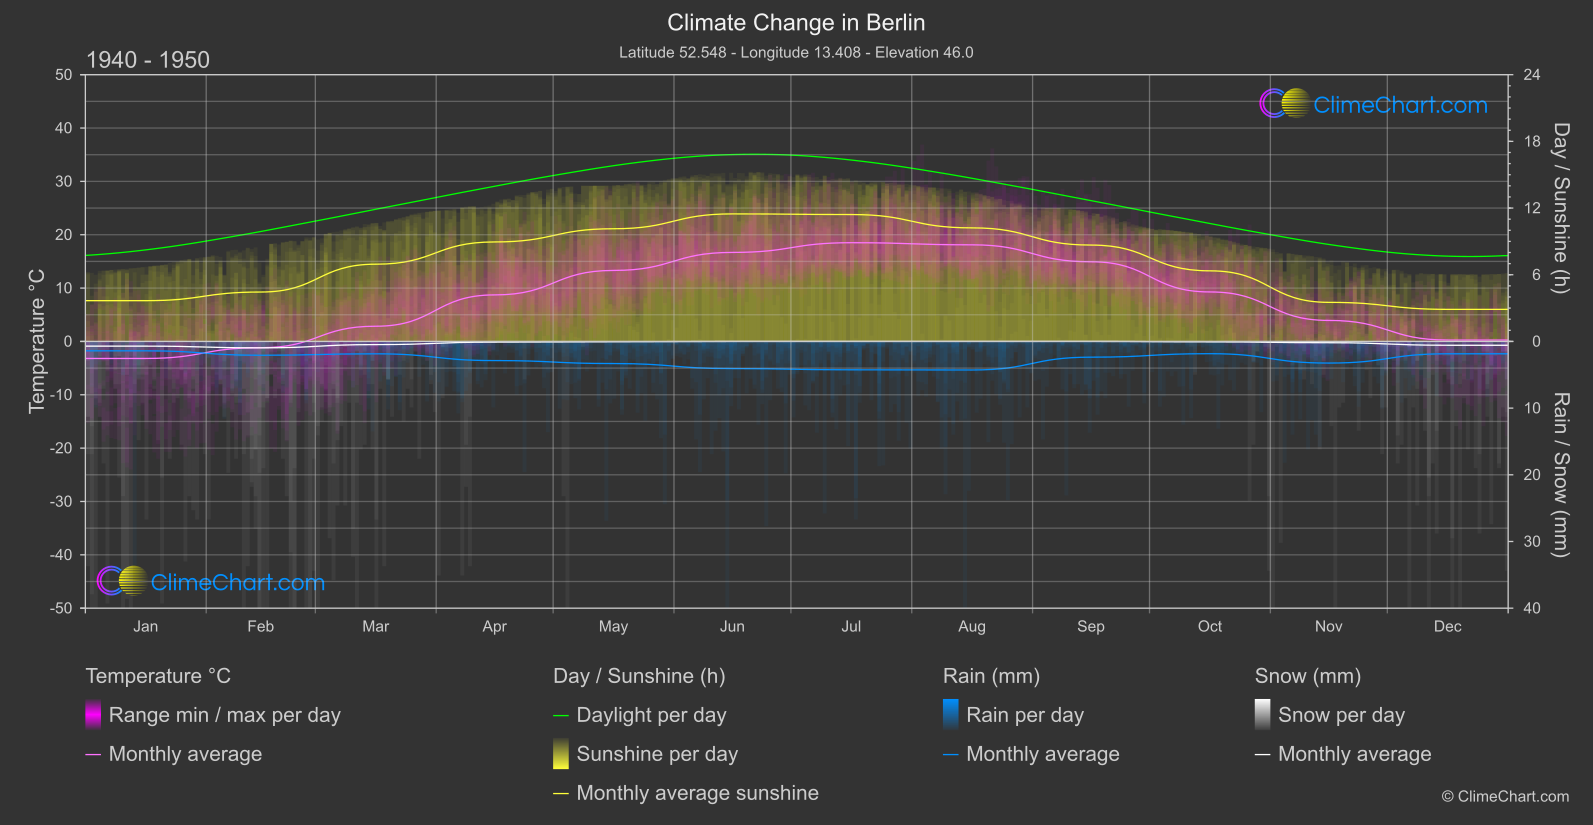
Berlin, the capital city of Germany, has witnessed significant changes in its climate over the years. The data shows that temperatures have been increasing steadily, with the highest temperature change observed in June. Rainfall patterns have also shifted, with notable changes in October. Snowfall has decreased in most months, especially in May and June. Additionally, sunshine duration has fluctuated, indicating variations in cloud cover and atmospheric conditions.
Climate Change Data Overview for Berlin, Germany
Explore the comprehensive climate change data for Berlin, Germany. This detailed table provides valuable insights into temperature variations, precipitation levels, and seasonal changes influenced by climate change, helping you understand the unique weather patterns of this region.
Temperature °C
| Month | ⌀ 1940 - 1950 | ⌀ 2013 - 2023 | +/- |
|---|---|---|---|
| Jan | -3.19 | 1.60 | 4.79 |
| Feb | -1.17 | 2.39 | 3.56 |
| Mar | 2.85 | 4.54 | 1.69 |
| Apr | 8.72 | 9.13 | 0.41 |
| May | 13.31 | 14.07 | 0.76 |
| Jun | 16.69 | 19.06 | 2.38 |
| Jul | 18.51 | 20.10 | 1.60 |
| Aug | 18.11 | 20.18 | 2.07 |
| Sep | 14.93 | 15.85 | 0.92 |
| Oct | 9.28 | 11.22 | 1.94 |
| Nov | 3.94 | 5.97 | 2.03 |
| Dec | 0.27 | 3.43 | 3.16 |
| ⌀ Month | 8.52 | 10.63 | 2.11 |
Sunshine (h)
| Month | ⌀ 1940 - 1950 | ⌀ 2013 - 2023 | +/- |
|---|---|---|---|
| Jan | 3.67 | 2.63 | -1.03 |
| Feb | 4.44 | 4.99 | 0.54 |
| Mar | 6.95 | 6.77 | -0.18 |
| Apr | 8.95 | 9.48 | 0.53 |
| May | 10.14 | 10.71 | 0.58 |
| Jun | 11.47 | 11.89 | 0.42 |
| Jul | 11.42 | 11.67 | 0.26 |
| Aug | 10.22 | 10.70 | 0.48 |
| Sep | 8.67 | 8.55 | -0.12 |
| Oct | 6.35 | 5.62 | -0.73 |
| Nov | 3.52 | 3.54 | 0.03 |
| Dec | 2.88 | 2.39 | -0.49 |
| ⌀ Month | 7.39 | 7.41 | 0.02 |
Rain (mm)
| Month | ⌀ 1940 - 1950 | ⌀ 2013 - 2023 | +/- |
|---|---|---|---|
| Jan | 0.70 | 1.33 | 0.63 |
| Feb | 1.04 | 1.23 | 0.19 |
| Mar | 0.93 | 1.17 | 0.24 |
| Apr | 1.44 | 1.09 | -0.34 |
| May | 1.66 | 1.55 | -0.11 |
| Jun | 2.04 | 2.33 | 0.29 |
| Jul | 2.13 | 2.22 | 0.10 |
| Aug | 2.14 | 1.63 | -0.51 |
| Sep | 1.18 | 1.37 | 0.19 |
| Oct | 0.92 | 1.85 | 0.93 |
| Nov | 1.62 | 1.47 | -0.15 |
| Dec | 0.93 | 1.50 | 0.58 |
| ⌀ Month | 1.39 | 1.56 | 0.17 |
Snow (mm)
| Month | ⌀ 1940 - 1950 | ⌀ 2013 - 2023 | +/- |
|---|---|---|---|
| Jan | 0.35 | 0.31 | -0.04 |
| Feb | 0.48 | 0.17 | -0.32 |
| Mar | 0.24 | 0.17 | -0.07 |
| Apr | 0.05 | 0.02 | -0.03 |
| May | 0.02 | 0.00 | -0.02 |
| Jun | 0.00 | 0.00 | 0.00 |
| Jul | 0.00 | 0.00 | 0.00 |
| Aug | 0.00 | 0.00 | 0.00 |
| Sep | 0.00 | 0.00 | 0.00 |
| Oct | 0.03 | 0.00 | -0.03 |
| Nov | 0.10 | 0.05 | -0.05 |
| Dec | 0.29 | 0.12 | -0.17 |
| ⌀ Month | 0.13 | 0.07 | -0.06 |