Climate Change Chart of Benidorm, Spain
Comprehensive Climate Change Chart of Benidorm, Spain: Monthly Averages and Impact Trends
Explore the climate change data for Benidorm, Spain, comparing temperatures, rainfall, snowfall, and sunshine duration between 1940-1950 and 2013-2024.
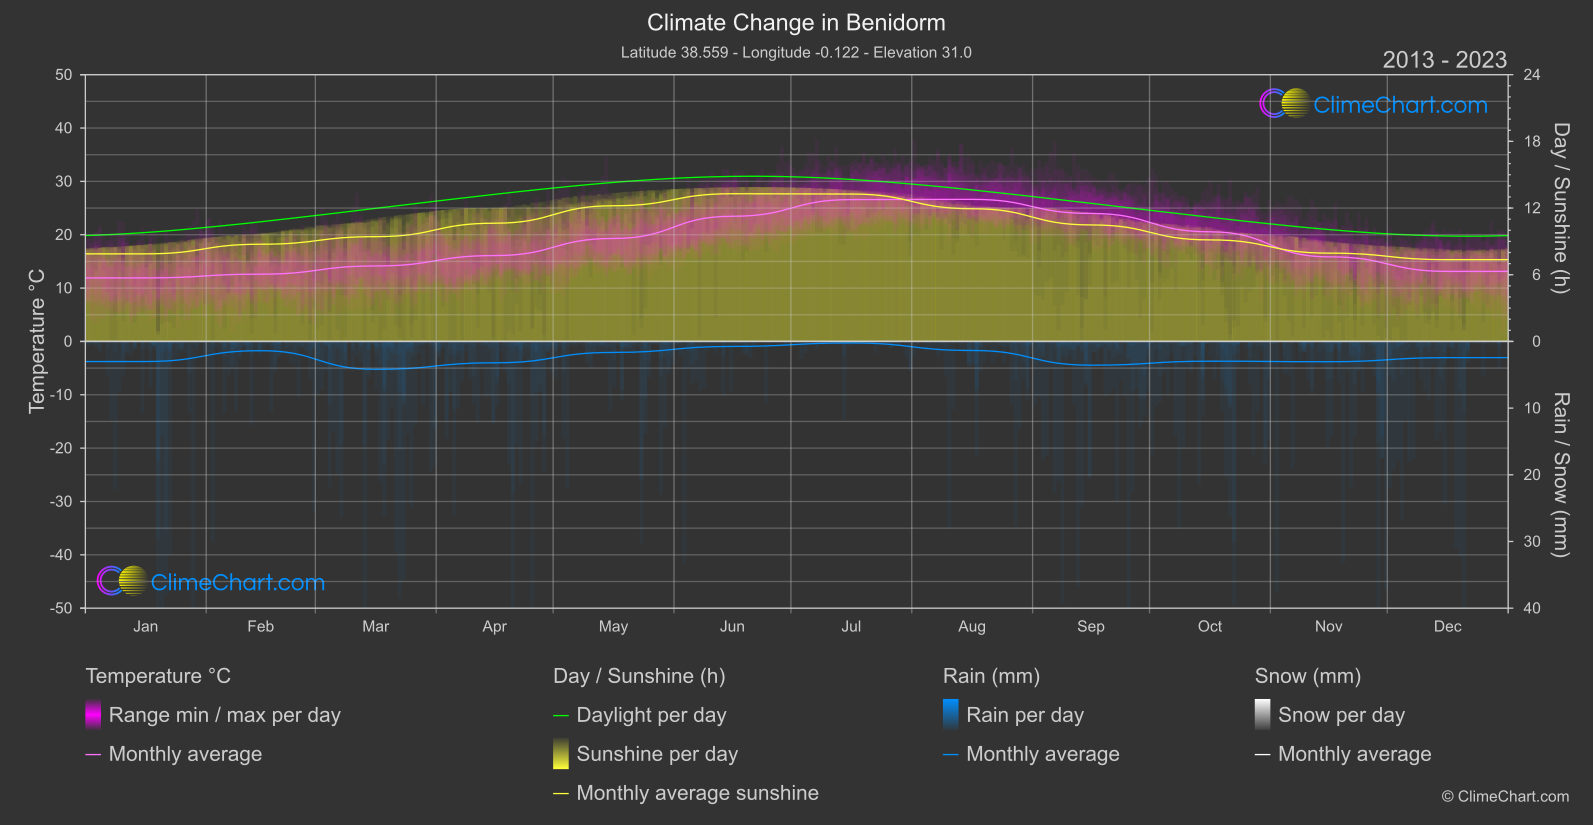
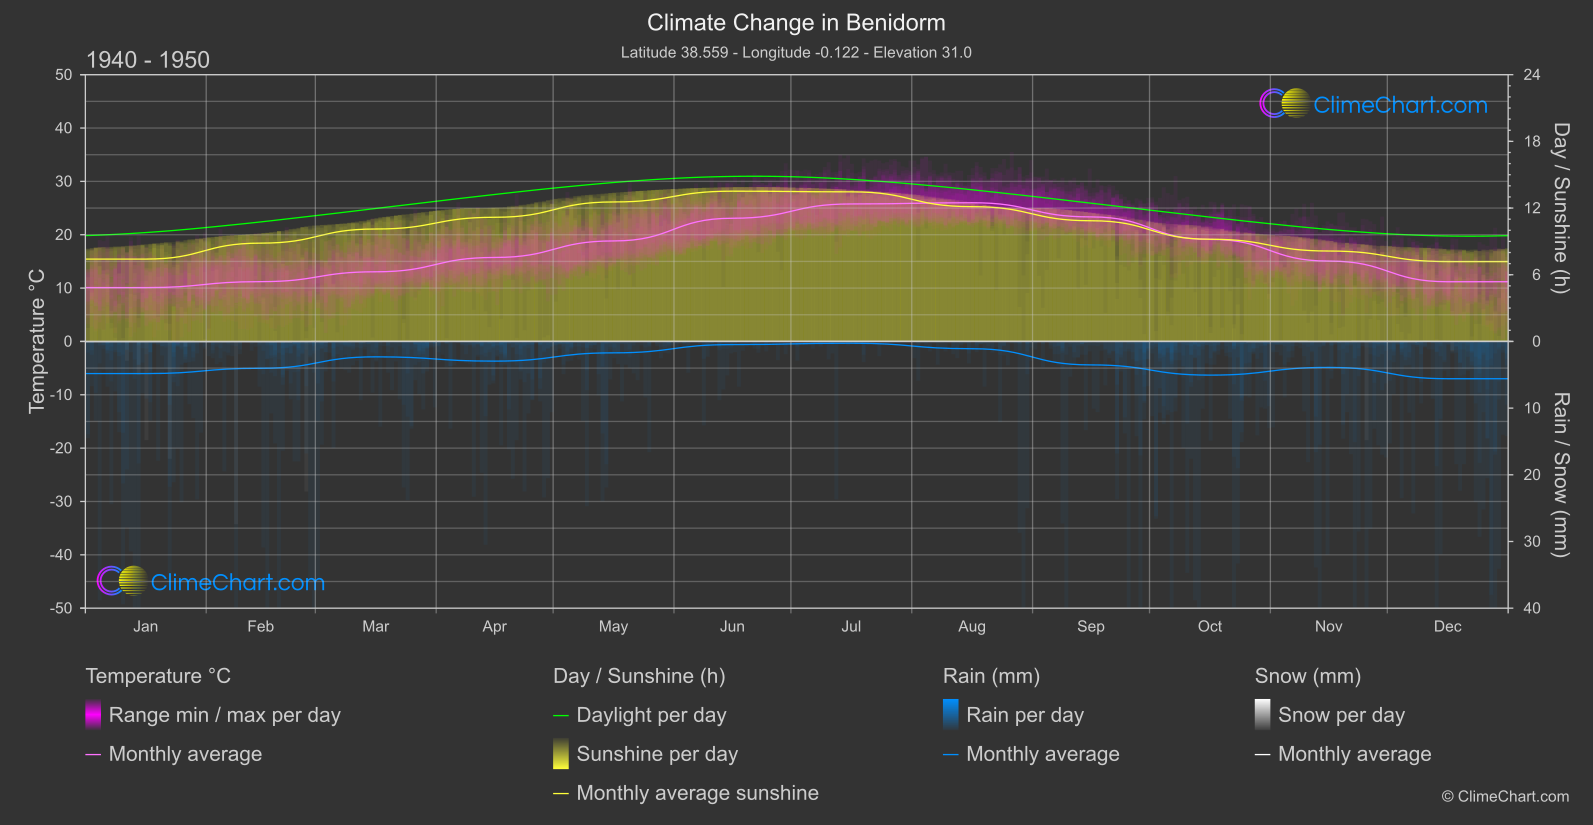
Benidorm, a coastal city in Spain, has experienced noticeable climate changes over the years. From the data provided, it is evident that temperatures have generally increased, with the month of December showing the highest temperature change. Rainfall patterns have also shifted, with notable decreases in certain months like October and December. Snowfall has significantly reduced, and sunshine duration has seen minor fluctuations throughout the months.
Climate Change Data Overview for Benidorm, Spain
Explore the comprehensive climate change data for Benidorm, Spain. This detailed table provides valuable insights into temperature variations, precipitation levels, and seasonal changes influenced by climate change, helping you understand the unique weather patterns of this region.
Temperature °C
| Month | ⌀ 1940 - 1950 | ⌀ 2013 - 2023 | +/- |
|---|---|---|---|
| Jan | 10.09 | 11.90 | 1.81 |
| Feb | 11.21 | 12.61 | 1.40 |
| Mar | 13.05 | 14.15 | 1.09 |
| Apr | 15.74 | 16.09 | 0.36 |
| May | 18.84 | 19.30 | 0.46 |
| Jun | 23.09 | 23.46 | 0.37 |
| Jul | 25.77 | 26.59 | 0.82 |
| Aug | 26.00 | 26.63 | 0.64 |
| Sep | 23.34 | 23.99 | 0.65 |
| Oct | 19.12 | 20.55 | 1.43 |
| Nov | 15.06 | 15.86 | 0.80 |
| Dec | 11.19 | 13.13 | 1.94 |
| ⌀ Month | 17.71 | 18.69 | 0.98 |
Sunshine (h)
| Month | ⌀ 1940 - 1950 | ⌀ 2013 - 2023 | +/- |
|---|---|---|---|
| Jan | 7.41 | 7.88 | 0.47 |
| Feb | 8.84 | 8.75 | -0.10 |
| Mar | 10.11 | 9.43 | -0.69 |
| Apr | 11.17 | 10.64 | -0.53 |
| May | 12.55 | 12.21 | -0.34 |
| Jun | 13.52 | 13.29 | -0.23 |
| Jul | 13.46 | 13.26 | -0.20 |
| Aug | 12.13 | 11.94 | -0.19 |
| Sep | 10.86 | 10.48 | -0.38 |
| Oct | 9.19 | 9.14 | -0.06 |
| Nov | 8.13 | 7.94 | -0.19 |
| Dec | 7.18 | 7.36 | 0.17 |
| ⌀ Month | 10.38 | 10.19 | -0.19 |
Rain (mm)
| Month | ⌀ 1940 - 1950 | ⌀ 2013 - 2023 | +/- |
|---|---|---|---|
| Jan | 2.41 | 1.51 | -0.90 |
| Feb | 2.01 | 0.69 | -1.32 |
| Mar | 1.16 | 2.09 | 0.94 |
| Apr | 1.48 | 1.60 | 0.13 |
| May | 0.86 | 0.82 | -0.03 |
| Jun | 0.24 | 0.37 | 0.14 |
| Jul | 0.13 | 0.12 | -0.02 |
| Aug | 0.55 | 0.68 | 0.13 |
| Sep | 1.76 | 1.78 | 0.02 |
| Oct | 2.53 | 1.48 | -1.04 |
| Nov | 1.95 | 1.52 | -0.42 |
| Dec | 2.80 | 1.22 | -1.58 |
| ⌀ Month | 1.49 | 1.16 | -0.33 |
Snow (mm)
| Month | ⌀ 1940 - 1950 | ⌀ 2013 - 2023 | +/- |
|---|---|---|---|
| Jan | 0.01 | 0.00 | -0.01 |
| Feb | 0.02 | 0.00 | -0.02 |
| Mar | 0.00 | 0.00 | 0.00 |
| Apr | 0.00 | 0.00 | 0.00 |
| May | 0.00 | 0.00 | 0.00 |
| Jun | 0.00 | 0.00 | 0.00 |
| Jul | 0.00 | 0.00 | 0.00 |
| Aug | 0.00 | 0.00 | 0.00 |
| Sep | 0.00 | 0.00 | 0.00 |
| Oct | 0.00 | 0.00 | 0.00 |
| Nov | 0.00 | 0.00 | -0.00 |
| Dec | 0.00 | 0.00 | -0.00 |
| ⌀ Month | 0.00 | 0.00 | -0.00 |