Climate Change Chart of Belfast, Great Britain
Comprehensive Climate Change Chart of Belfast, Great Britain: Monthly Averages and Impact Trends
Explore the changing climate in Belfast, United Kingdom of Great Britain and Northern Ireland with insightful data comparisons. Discover how temperatures, rainfall, snowfall, and sunshine duration have evolved over the years.
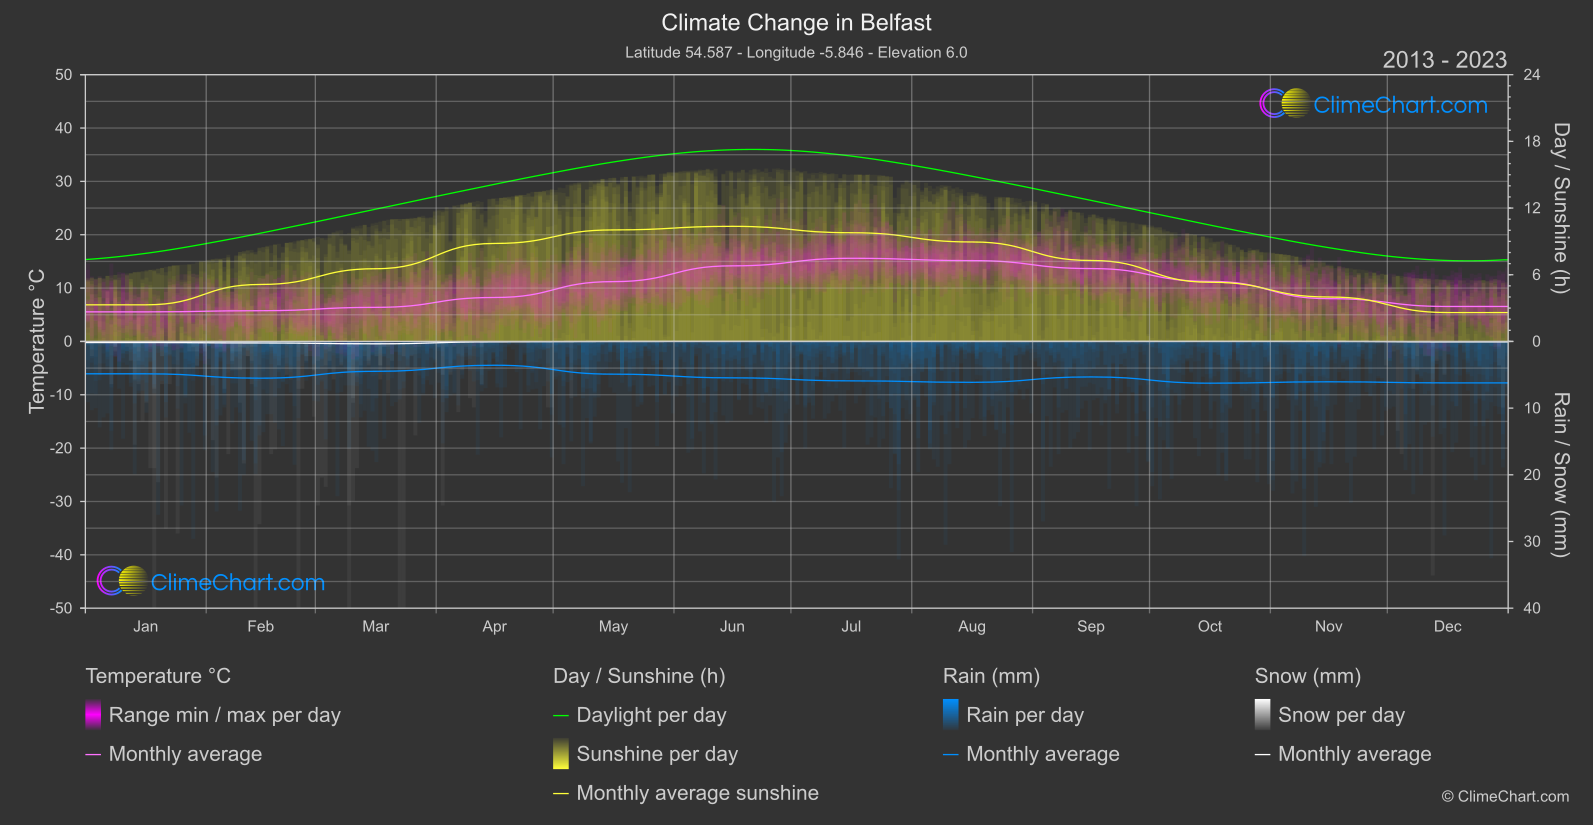
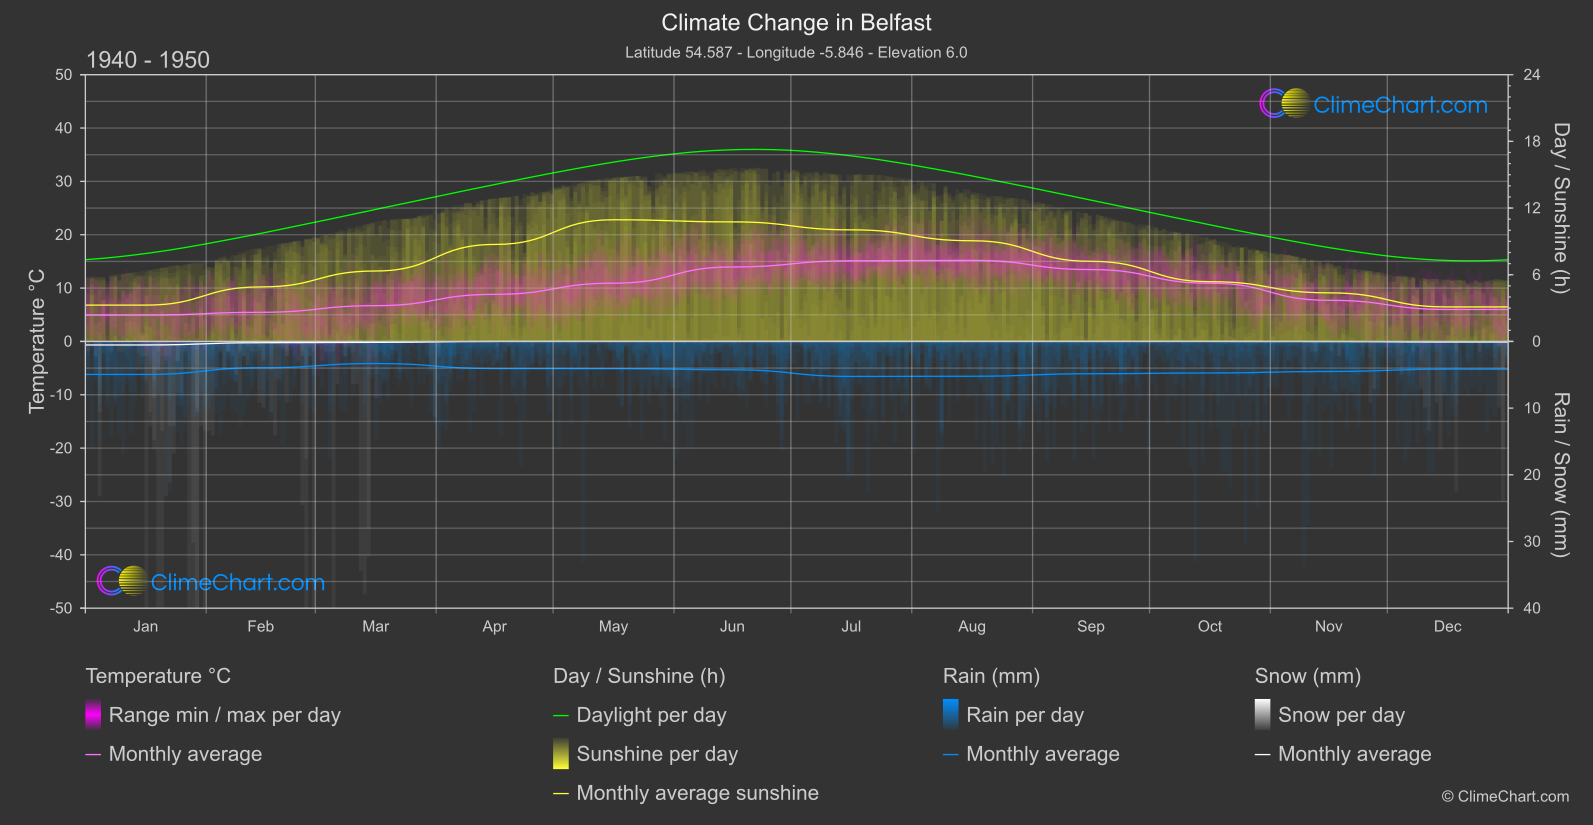
Belfast, located in the United Kingdom of Great Britain and Northern Ireland, has experienced significant changes in its climate over the years. From the data provided, we can observe that the month with the highest temperature change is December, with a difference of 0.570°C between the periods 1940 - 1950 and 2013 - 2024. In terms of rainfall, December also stands out with a remarkable increase in precipitation of 1.029 mm. Snowfall in Belfast has generally decreased over the years, with March showing the highest decrease in snowfall of 0.108 mm. The sunshine duration in Belfast has fluctuated, with May experiencing the most significant decrease in sunshine hours of 0.914 hours.
Climate Change Data Overview for Belfast, Great Britain
Explore the comprehensive climate change data for Belfast, Great Britain. This detailed table provides valuable insights into temperature variations, precipitation levels, and seasonal changes influenced by climate change, helping you understand the unique weather patterns of this region.
Temperature °C
| Month | ⌀ 1940 - 1950 | ⌀ 2013 - 2023 | +/- |
|---|---|---|---|
| Jan | 4.93 | 5.54 | 0.61 |
| Feb | 5.46 | 5.76 | 0.30 |
| Mar | 6.71 | 6.39 | -0.32 |
| Apr | 8.83 | 8.24 | -0.59 |
| May | 10.92 | 11.21 | 0.30 |
| Jun | 13.96 | 14.17 | 0.21 |
| Jul | 15.12 | 15.59 | 0.47 |
| Aug | 15.19 | 15.15 | -0.04 |
| Sep | 13.47 | 13.66 | 0.19 |
| Oct | 10.91 | 11.26 | 0.35 |
| Nov | 7.71 | 8.02 | 0.31 |
| Dec | 5.98 | 6.55 | 0.57 |
| ⌀ Month | 9.93 | 10.13 | 0.20 |
Sunshine (h)
| Month | ⌀ 1940 - 1950 | ⌀ 2013 - 2023 | +/- |
|---|---|---|---|
| Jan | 3.27 | 3.29 | 0.03 |
| Feb | 4.90 | 5.13 | 0.22 |
| Mar | 6.34 | 6.54 | 0.20 |
| Apr | 8.73 | 8.82 | 0.09 |
| May | 10.95 | 10.03 | -0.91 |
| Jun | 10.76 | 10.36 | -0.40 |
| Jul | 10.04 | 9.78 | -0.26 |
| Aug | 9.06 | 8.95 | -0.11 |
| Sep | 7.21 | 7.28 | 0.08 |
| Oct | 5.38 | 5.33 | -0.05 |
| Nov | 4.37 | 4.00 | -0.37 |
| Dec | 3.10 | 2.60 | -0.51 |
| ⌀ Month | 7.01 | 6.84 | -0.17 |
Rain (mm)
| Month | ⌀ 1940 - 1950 | ⌀ 2013 - 2023 | +/- |
|---|---|---|---|
| Jan | 2.48 | 2.43 | -0.05 |
| Feb | 1.98 | 2.75 | 0.78 |
| Mar | 1.65 | 2.24 | 0.59 |
| Apr | 2.03 | 1.79 | -0.25 |
| May | 2.04 | 2.45 | 0.42 |
| Jun | 2.13 | 2.73 | 0.60 |
| Jul | 2.62 | 2.96 | 0.33 |
| Aug | 2.61 | 3.07 | 0.46 |
| Sep | 2.42 | 2.66 | 0.24 |
| Oct | 2.36 | 3.13 | 0.77 |
| Nov | 2.25 | 3.03 | 0.77 |
| Dec | 2.08 | 3.11 | 1.03 |
| ⌀ Month | 2.22 | 2.70 | 0.47 |
Snow (mm)
| Month | ⌀ 1940 - 1950 | ⌀ 2013 - 2023 | +/- |
|---|---|---|---|
| Jan | 0.26 | 0.08 | -0.18 |
| Feb | 0.10 | 0.11 | 0.02 |
| Mar | 0.07 | 0.18 | 0.11 |
| Apr | 0.00 | 0.03 | 0.03 |
| May | 0.00 | 0.00 | 0.00 |
| Jun | 0.00 | 0.00 | 0.00 |
| Jul | 0.00 | 0.00 | 0.00 |
| Aug | 0.00 | 0.00 | 0.00 |
| Sep | 0.00 | 0.00 | 0.00 |
| Oct | 0.00 | 0.00 | 0.00 |
| Nov | 0.01 | 0.00 | -0.01 |
| Dec | 0.05 | 0.03 | -0.01 |
| ⌀ Month | 0.04 | 0.04 | -0.00 |