Climate Change Chart of Basel, Switzerland
Comprehensive Climate Change Chart of Basel, Switzerland: Monthly Averages and Impact Trends
Explore the changing climate in Basel, Switzerland with insights from historical data.
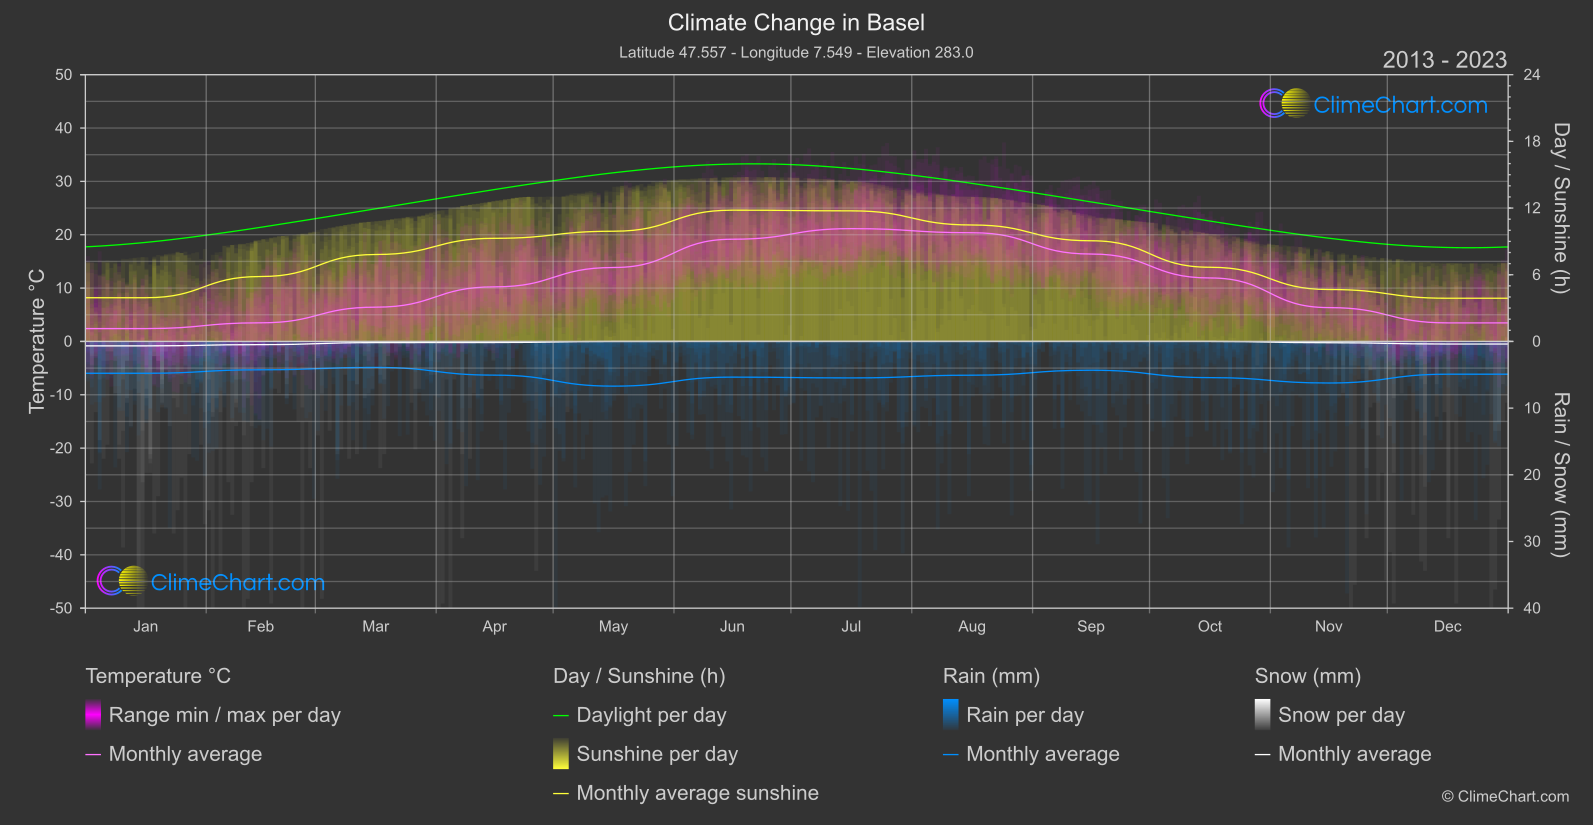
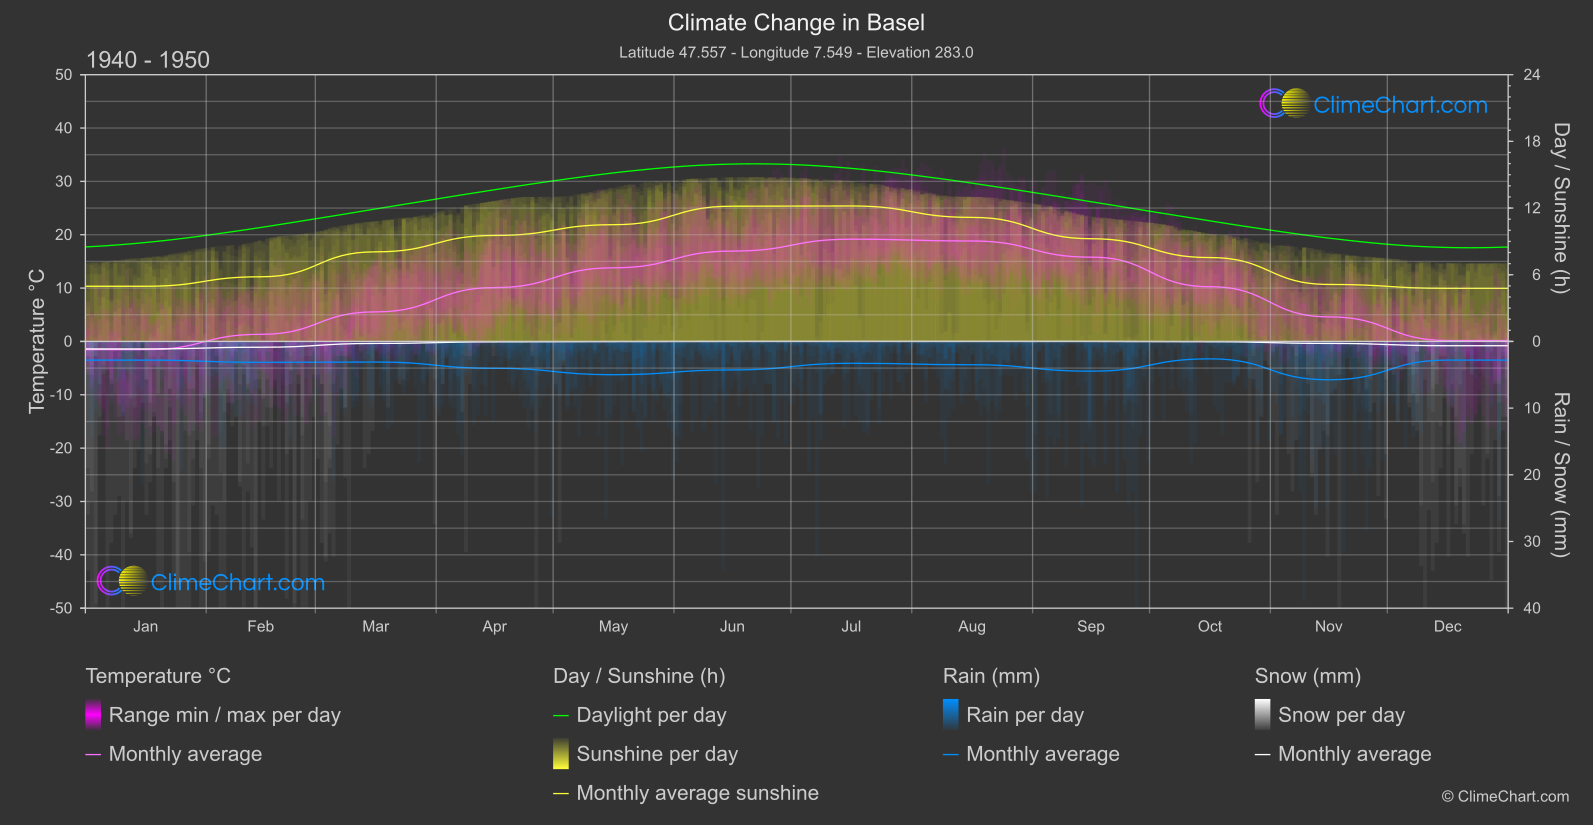
Basel, Switzerland has experienced significant changes in temperature, rainfall, snowfall, and sunshine duration over the years. From the data comparison between 1940 - 1950 and 2013 - 2024, it is evident that the month with the highest temperature change is December, with a rise of 3.30°C. In terms of rainfall, the month with the most significant change is October, with an increase of 1.41 mm. Snowfall has notably decreased in several months, with the highest drop occurring in December. Furthermore, sunshine duration has decreased notably in August, showing a change of -0.68 hours.
Climate Change Data Overview for Basel, Switzerland
Explore the comprehensive climate change data for Basel, Switzerland. This detailed table provides valuable insights into temperature variations, precipitation levels, and seasonal changes influenced by climate change, helping you understand the unique weather patterns of this region.
Temperature °C
| Month | ⌀ 1940 - 1950 | ⌀ 2013 - 2023 | +/- |
|---|---|---|---|
| Jan | -1.54 | 2.41 | 3.95 |
| Feb | 1.33 | 3.49 | 2.16 |
| Mar | 5.54 | 6.42 | 0.88 |
| Apr | 10.09 | 10.23 | 0.14 |
| May | 13.80 | 13.86 | 0.06 |
| Jun | 16.94 | 19.16 | 2.22 |
| Jul | 19.16 | 21.14 | 1.98 |
| Aug | 18.83 | 20.37 | 1.55 |
| Sep | 15.80 | 16.38 | 0.59 |
| Oct | 10.25 | 11.90 | 1.64 |
| Nov | 4.61 | 6.34 | 1.74 |
| Dec | 0.17 | 3.48 | 3.30 |
| ⌀ Month | 9.58 | 11.26 | 1.68 |
Sunshine (h)
| Month | ⌀ 1940 - 1950 | ⌀ 2013 - 2023 | +/- |
|---|---|---|---|
| Jan | 4.96 | 3.93 | -1.03 |
| Feb | 5.82 | 5.84 | 0.02 |
| Mar | 8.06 | 7.82 | -0.24 |
| Apr | 9.53 | 9.28 | -0.26 |
| May | 10.50 | 9.92 | -0.59 |
| Jun | 12.17 | 11.81 | -0.36 |
| Jul | 12.19 | 11.75 | -0.44 |
| Aug | 11.16 | 10.48 | -0.68 |
| Sep | 9.24 | 9.06 | -0.18 |
| Oct | 7.54 | 6.67 | -0.87 |
| Nov | 5.13 | 4.67 | -0.46 |
| Dec | 4.77 | 3.89 | -0.89 |
| ⌀ Month | 8.42 | 7.93 | -0.50 |
Rain (mm)
| Month | ⌀ 1940 - 1950 | ⌀ 2013 - 2023 | +/- |
|---|---|---|---|
| Jan | 1.40 | 2.39 | 0.99 |
| Feb | 1.57 | 2.13 | 0.56 |
| Mar | 1.54 | 1.95 | 0.41 |
| Apr | 2.01 | 2.53 | 0.51 |
| May | 2.49 | 3.35 | 0.86 |
| Jun | 2.13 | 2.68 | 0.54 |
| Jul | 1.64 | 2.74 | 1.10 |
| Aug | 1.75 | 2.53 | 0.78 |
| Sep | 2.23 | 2.16 | -0.07 |
| Oct | 1.31 | 2.71 | 1.41 |
| Nov | 2.87 | 3.12 | 0.24 |
| Dec | 1.40 | 2.46 | 1.06 |
| ⌀ Month | 1.86 | 2.56 | 0.70 |
Snow (mm)
| Month | ⌀ 1940 - 1950 | ⌀ 2013 - 2023 | +/- |
|---|---|---|---|
| Jan | 0.56 | 0.33 | -0.23 |
| Feb | 0.44 | 0.24 | -0.20 |
| Mar | 0.15 | 0.09 | -0.06 |
| Apr | 0.03 | 0.08 | 0.05 |
| May | 0.01 | 0.00 | -0.01 |
| Jun | 0.00 | 0.00 | 0.00 |
| Jul | 0.00 | 0.00 | 0.00 |
| Aug | 0.00 | 0.00 | 0.00 |
| Sep | 0.00 | 0.00 | 0.00 |
| Oct | 0.02 | 0.00 | -0.02 |
| Nov | 0.15 | 0.10 | -0.05 |
| Dec | 0.32 | 0.19 | -0.12 |
| ⌀ Month | 0.14 | 0.09 | -0.05 |