Climate Change Chart of Barcelona, Spain
Comprehensive Climate Change Chart of Barcelona, Spain: Monthly Averages and Impact Trends
Exploring the climate change data for Barcelona, Spain reveals intriguing insights into temperature, rainfall, snowfall, and sunshine duration over the years.
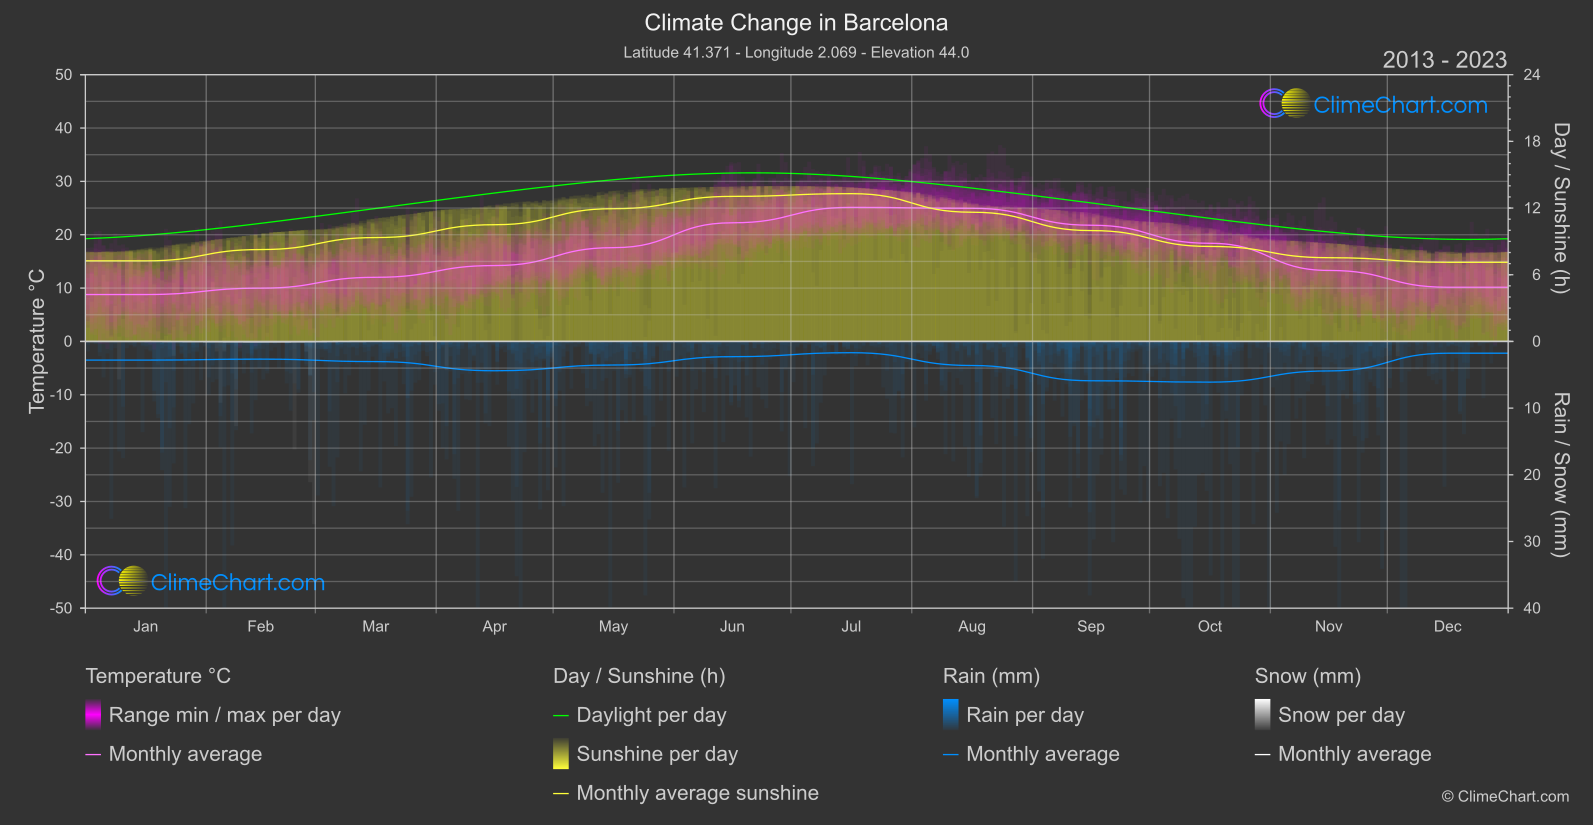
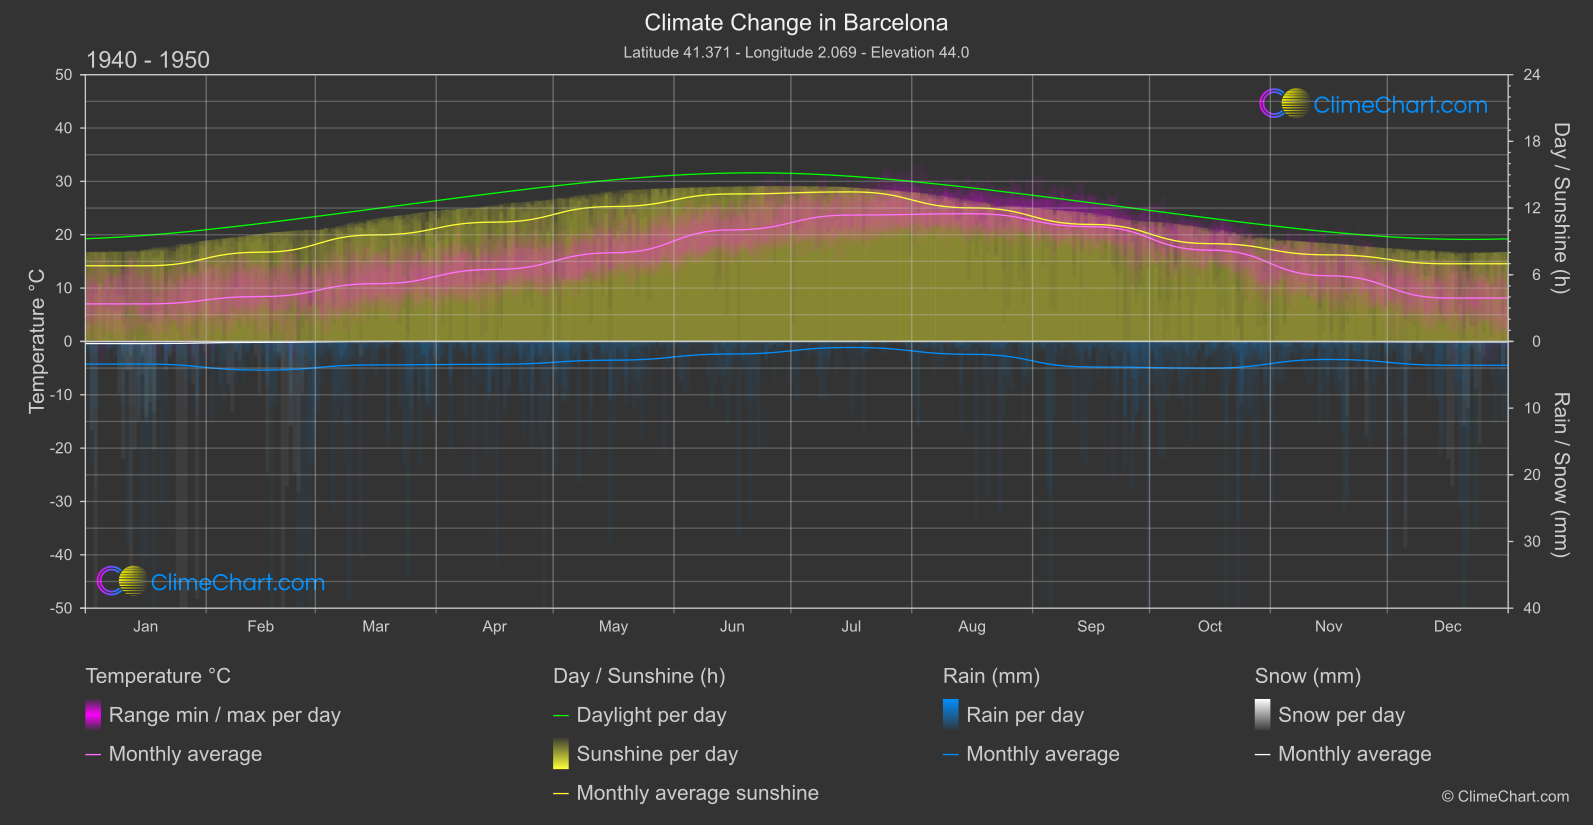
Barcelona, Spain has experienced notable changes in climate over the years. From the data, it is evident that December shows the highest temperature change with an increase of 2.03°C, while March has the lowest temperature change of 1.21°C. In terms of rainfall, September exhibits the highest increase in rainfall with 1.03 mm, whereas December sees a significant decrease of 0.90 mm. Snowfall remains minimal throughout the years, with negligible changes. Sunshine duration in Barcelona sees a decline in August with a change of -0.39 hours, while January experiences the highest increase with 0.44 hours.
Climate Change Data Overview for Barcelona, Spain
Explore the comprehensive climate change data for Barcelona, Spain. This detailed table provides valuable insights into temperature variations, precipitation levels, and seasonal changes influenced by climate change, helping you understand the unique weather patterns of this region.
Temperature °C
| Month | ⌀ 1940 - 1950 | ⌀ 2013 - 2023 | +/- |
|---|---|---|---|
| Jan | 7.03 | 8.79 | 1.76 |
| Feb | 8.41 | 9.99 | 1.57 |
| Mar | 10.81 | 12.02 | 1.21 |
| Apr | 13.50 | 14.22 | 0.72 |
| May | 16.62 | 17.58 | 0.96 |
| Jun | 20.91 | 22.24 | 1.33 |
| Jul | 23.69 | 25.13 | 1.44 |
| Aug | 23.94 | 24.95 | 1.02 |
| Sep | 21.51 | 21.78 | 0.27 |
| Oct | 17.11 | 18.39 | 1.29 |
| Nov | 12.31 | 13.31 | 1.00 |
| Dec | 8.13 | 10.16 | 2.03 |
| ⌀ Month | 15.33 | 16.55 | 1.22 |
Sunshine (h)
| Month | ⌀ 1940 - 1950 | ⌀ 2013 - 2023 | +/- |
|---|---|---|---|
| Jan | 6.81 | 7.25 | 0.44 |
| Feb | 8.03 | 8.27 | 0.24 |
| Mar | 9.59 | 9.35 | -0.24 |
| Apr | 10.73 | 10.50 | -0.23 |
| May | 12.14 | 11.94 | -0.19 |
| Jun | 13.27 | 13.05 | -0.22 |
| Jul | 13.45 | 13.30 | -0.16 |
| Aug | 12.02 | 11.62 | -0.39 |
| Sep | 10.53 | 9.97 | -0.55 |
| Oct | 8.80 | 8.55 | -0.25 |
| Nov | 7.79 | 7.53 | -0.25 |
| Dec | 6.99 | 7.12 | 0.14 |
| ⌀ Month | 10.01 | 9.87 | -0.14 |
Rain (mm)
| Month | ⌀ 1940 - 1950 | ⌀ 2013 - 2023 | +/- |
|---|---|---|---|
| Jan | 1.70 | 1.40 | -0.30 |
| Feb | 2.15 | 1.33 | -0.82 |
| Mar | 1.76 | 1.51 | -0.25 |
| Apr | 1.72 | 2.20 | 0.48 |
| May | 1.41 | 1.77 | 0.36 |
| Jun | 0.94 | 1.14 | 0.20 |
| Jul | 0.45 | 0.84 | 0.39 |
| Aug | 0.97 | 1.81 | 0.84 |
| Sep | 1.92 | 2.95 | 1.03 |
| Oct | 2.00 | 3.05 | 1.05 |
| Nov | 1.35 | 2.21 | 0.86 |
| Dec | 1.79 | 0.88 | -0.90 |
| ⌀ Month | 1.51 | 1.76 | 0.25 |
Snow (mm)
| Month | ⌀ 1940 - 1950 | ⌀ 2013 - 2023 | +/- |
|---|---|---|---|
| Jan | 0.16 | 0.00 | -0.15 |
| Feb | 0.07 | 0.03 | -0.04 |
| Mar | 0.00 | 0.00 | -0.00 |
| Apr | 0.00 | 0.00 | 0.00 |
| May | 0.00 | 0.00 | 0.00 |
| Jun | 0.00 | 0.00 | 0.00 |
| Jul | 0.00 | 0.00 | 0.00 |
| Aug | 0.00 | 0.00 | 0.00 |
| Sep | 0.00 | 0.00 | 0.00 |
| Oct | 0.00 | 0.00 | 0.00 |
| Nov | 0.01 | 0.00 | -0.01 |
| Dec | 0.04 | 0.00 | -0.04 |
| ⌀ Month | 0.02 | 0.00 | -0.02 |