Climate Change Chart of Bandar Seri Begawan, Brunei Darussalam
Comprehensive Climate Change Chart of Bandar Seri Begawan, Brunei Darussalam: Monthly Averages and Impact Trends
Exploring the changing climate in Bandar Seri Begawan, Brunei Darussalam reveals intriguing insights into temperature, rainfall, and sunshine duration trends over the years.
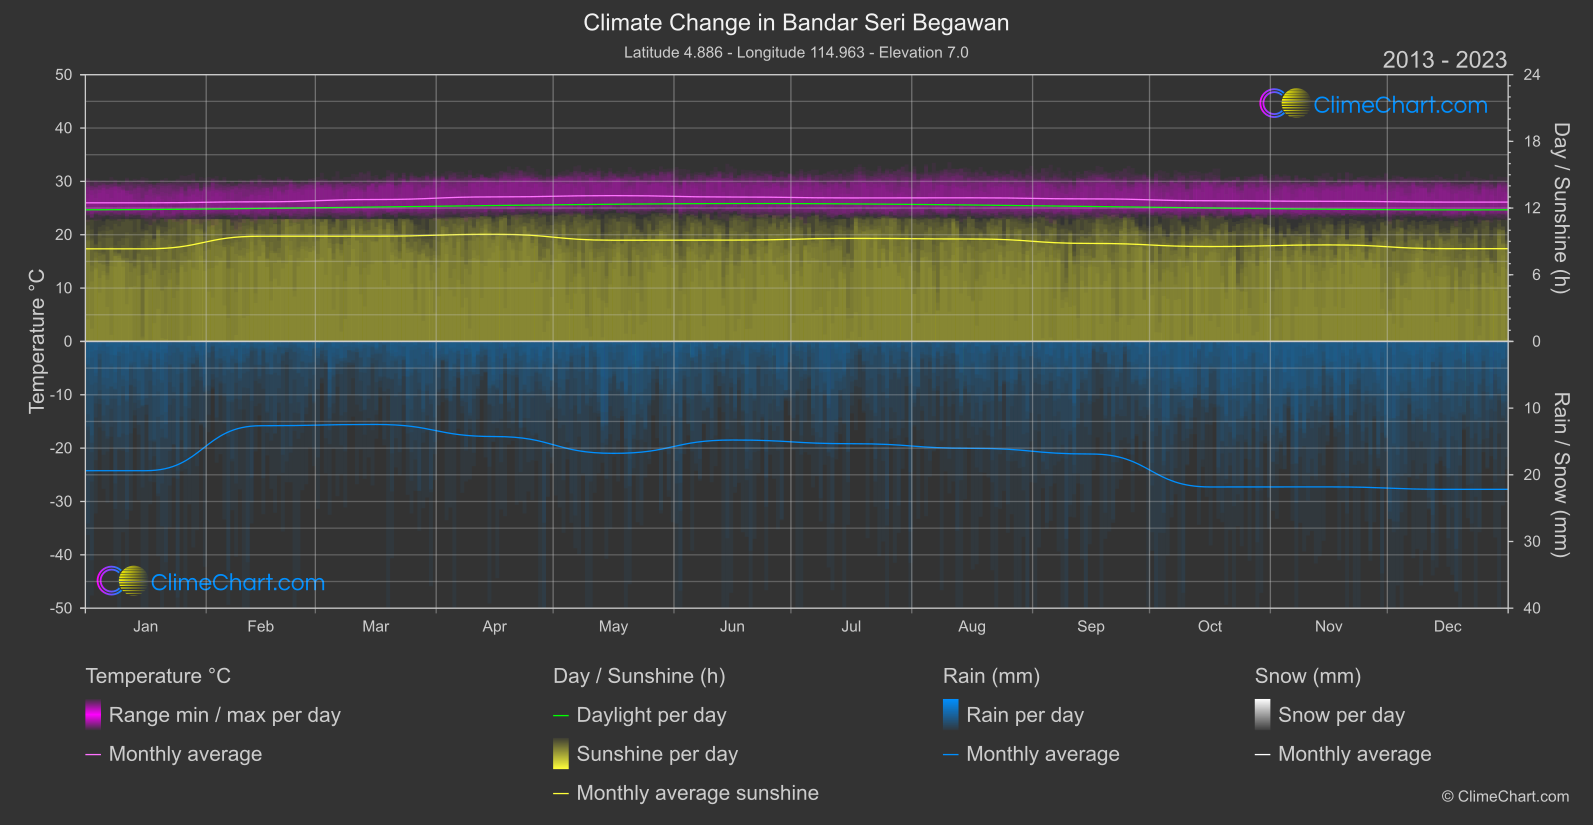
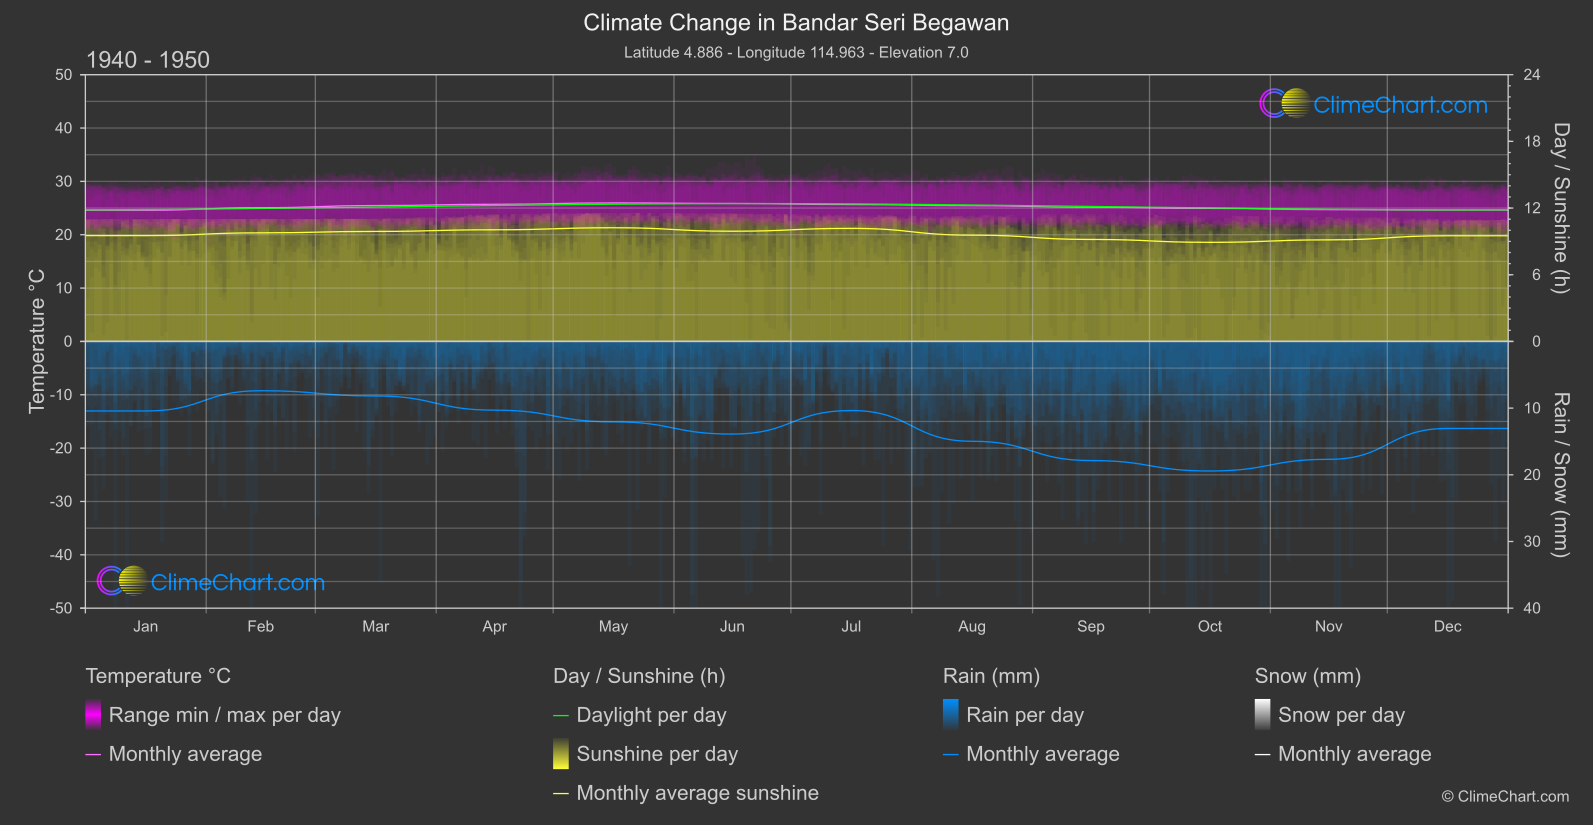
Bandar Seri Begawan, the capital of Brunei Darussalam, experiences notable changes in its climate patterns. Analyzing temperature data from 1940 to 1950 compared to 2013 to 2024 reveals a consistent increase in temperatures across most months. For instance, the month of September shows the highest temperature change of 1.56°C, indicating a significant warming trend. In terms of rainfall, the data illustrates varying patterns with some months experiencing an increase in rainfall while others show a decrease. December stands out with a substantial rainfall change of 4.57mm. Furthermore, the sunshine duration in Bandar Seri Begawan demonstrates a decrease in hours of sunlight in recent years compared to the past, with December showcasing the most significant drop of 1.16 hours. These insights highlight the complex shifts in climate parameters in this region.
Climate Change Data Overview for Bandar Seri Begawan, Brunei Darussalam
Explore the comprehensive climate change data for Bandar Seri Begawan, Brunei Darussalam. This detailed table provides valuable insights into temperature variations, precipitation levels, and seasonal changes influenced by climate change, helping you understand the unique weather patterns of this region.
Temperature °C
| Month | ⌀ 1940 - 1950 | ⌀ 2013 - 2023 | +/- |
|---|---|---|---|
| Jan | 24.59 | 25.98 | 1.39 |
| Feb | 25.07 | 26.17 | 1.11 |
| Mar | 25.47 | 26.60 | 1.13 |
| Apr | 25.71 | 27.09 | 1.38 |
| May | 25.96 | 27.33 | 1.37 |
| Jun | 25.86 | 27.07 | 1.21 |
| Jul | 25.66 | 26.90 | 1.24 |
| Aug | 25.44 | 26.92 | 1.48 |
| Sep | 25.15 | 26.72 | 1.56 |
| Oct | 24.94 | 26.37 | 1.43 |
| Nov | 24.70 | 26.27 | 1.57 |
| Dec | 24.63 | 26.12 | 1.49 |
| ⌀ Month | 25.27 | 26.63 | 1.36 |
Sunshine (h)
| Month | ⌀ 1940 - 1950 | ⌀ 2013 - 2023 | +/- |
|---|---|---|---|
| Jan | 9.52 | 8.33 | -1.19 |
| Feb | 9.77 | 9.47 | -0.30 |
| Mar | 9.90 | 9.47 | -0.43 |
| Apr | 10.05 | 9.64 | -0.40 |
| May | 10.23 | 9.11 | -1.12 |
| Jun | 9.92 | 9.12 | -0.80 |
| Jul | 10.17 | 9.27 | -0.90 |
| Aug | 9.56 | 9.22 | -0.35 |
| Sep | 9.18 | 8.82 | -0.36 |
| Oct | 8.92 | 8.54 | -0.38 |
| Nov | 9.14 | 8.68 | -0.45 |
| Dec | 9.51 | 8.35 | -1.16 |
| ⌀ Month | 9.65 | 9.00 | -0.65 |
Rain (mm)
| Month | ⌀ 1940 - 1950 | ⌀ 2013 - 2023 | +/- |
|---|---|---|---|
| Jan | 5.21 | 9.69 | 4.48 |
| Feb | 3.70 | 6.32 | 2.62 |
| Mar | 4.09 | 6.22 | 2.13 |
| Apr | 5.15 | 7.13 | 1.98 |
| May | 6.03 | 8.39 | 2.36 |
| Jun | 6.95 | 7.39 | 0.45 |
| Jul | 5.18 | 7.67 | 2.49 |
| Aug | 7.49 | 8.01 | 0.53 |
| Sep | 8.93 | 8.44 | -0.49 |
| Oct | 9.71 | 10.91 | 1.20 |
| Nov | 8.84 | 10.91 | 2.07 |
| Dec | 6.52 | 11.09 | 4.57 |
| ⌀ Month | 6.48 | 8.52 | 2.03 |
Snow (mm)
| Month | ⌀ 1940 - 1950 | ⌀ 2013 - 2023 | +/- |
|---|---|---|---|
| Jan | 0.00 | 0.00 | 0.00 |
| Feb | 0.00 | 0.00 | 0.00 |
| Mar | 0.00 | 0.00 | 0.00 |
| Apr | 0.00 | 0.00 | 0.00 |
| May | 0.00 | 0.00 | 0.00 |
| Jun | 0.00 | 0.00 | 0.00 |
| Jul | 0.00 | 0.00 | 0.00 |
| Aug | 0.00 | 0.00 | 0.00 |
| Sep | 0.00 | 0.00 | 0.00 |
| Oct | 0.00 | 0.00 | 0.00 |
| Nov | 0.00 | 0.00 | 0.00 |
| Dec | 0.00 | 0.00 | 0.00 |
| ⌀ Month | 0.00 | 0.00 | 0.00 |