Climate Change Chart of Bamako, Mali
Comprehensive Climate Change Chart of Bamako, Mali: Monthly Averages and Impact Trends
Explore the changing climate in Bamako, Mali through historical temperature, rainfall, and sunshine data. Discover the impacts of climate change on this region.
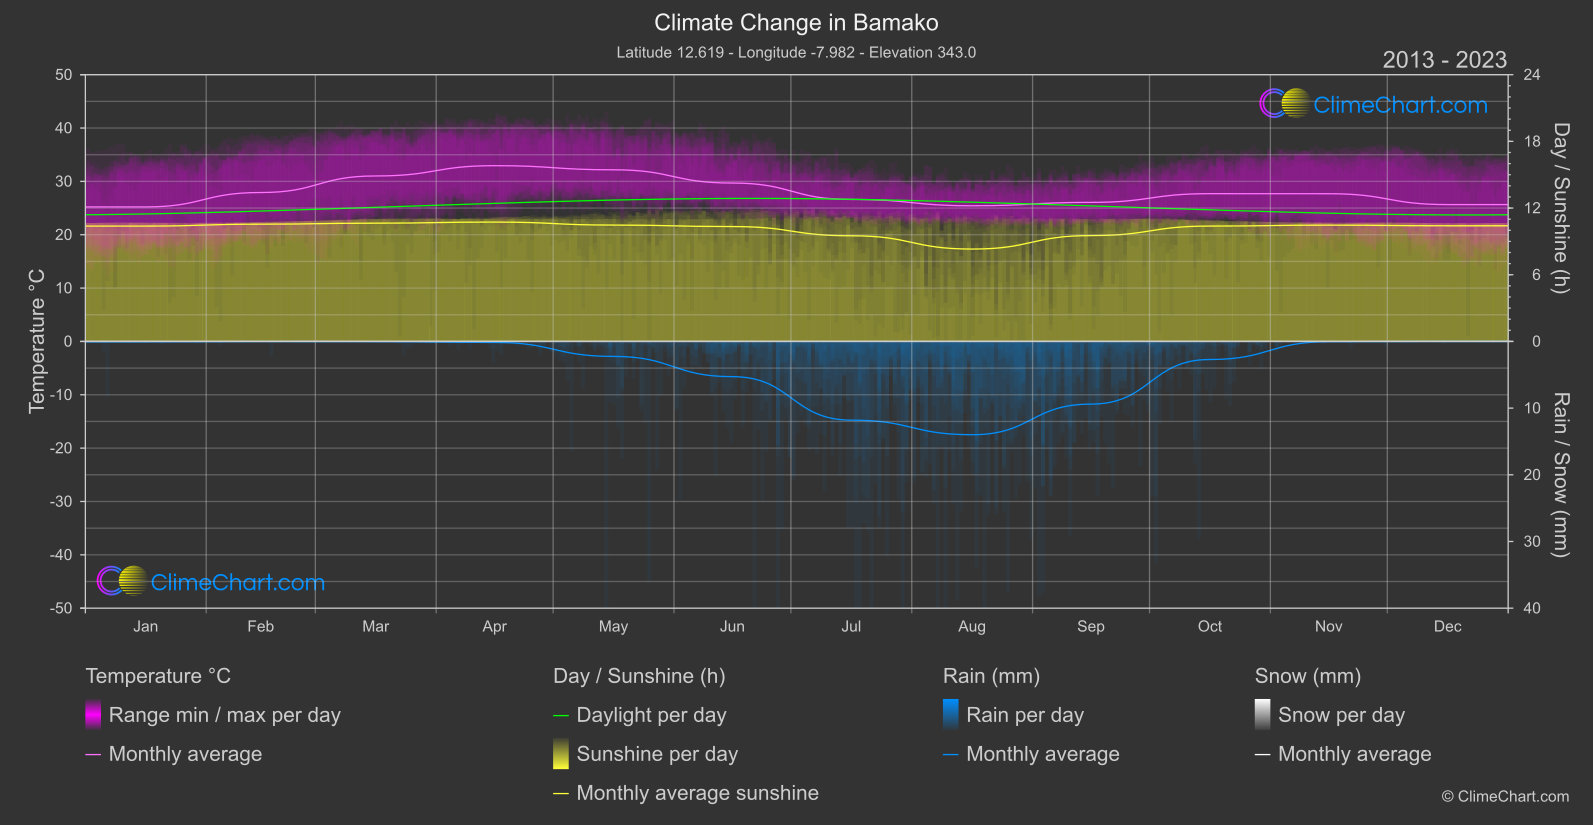
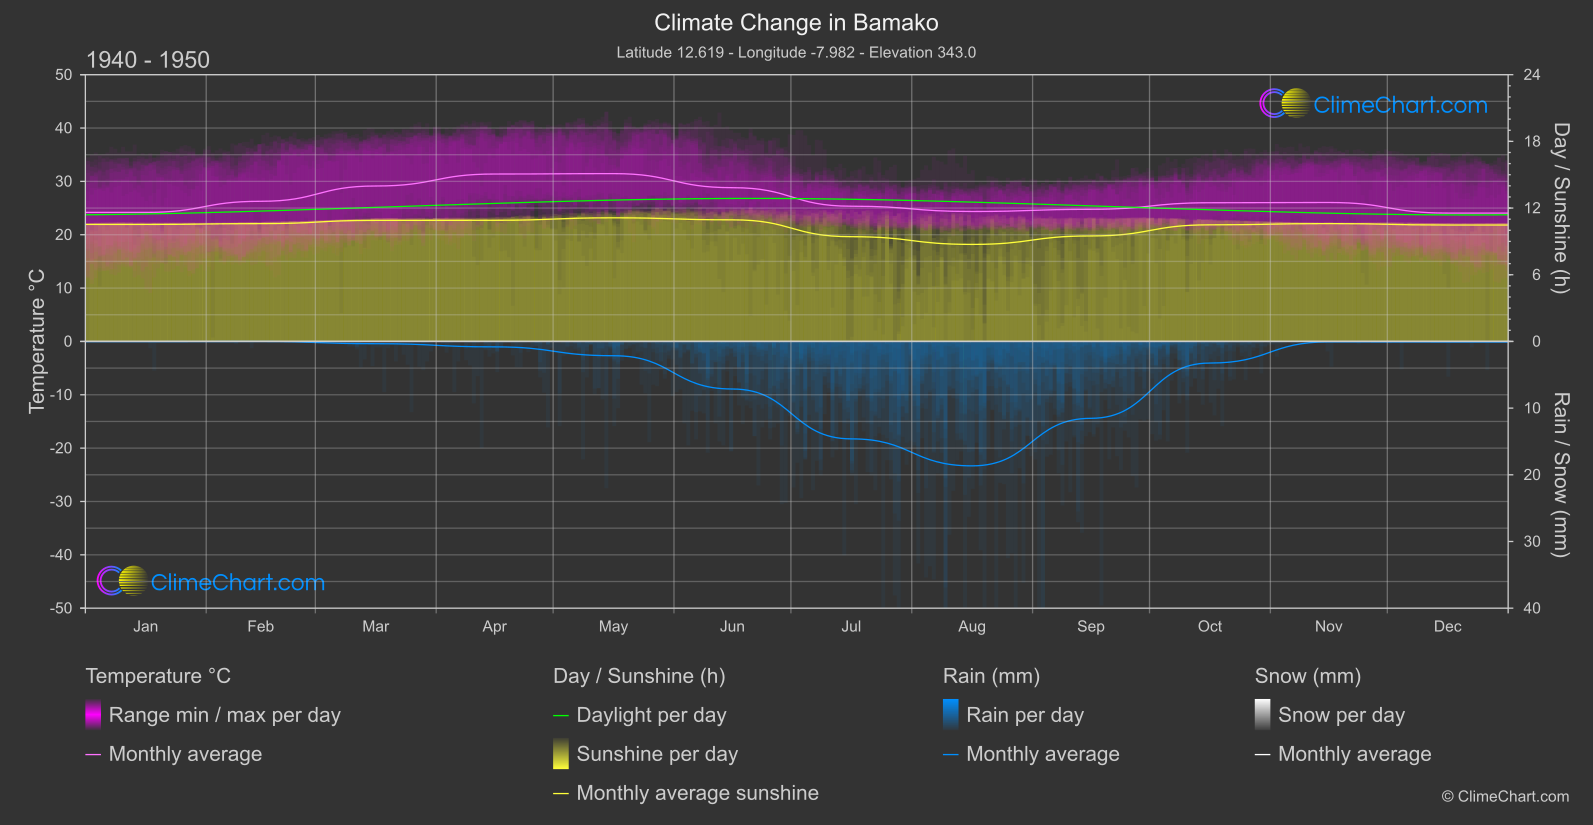
Bamako, Mali, has experienced notable changes in temperature, rainfall, and sunshine duration over the years. From the data comparison between the periods of 1940 - 1950 and 2013 - 2024, it is evident that the month with the highest temperature change is March, with an increase of 1.88°C. In terms of rainfall, the month with the most significant decrease is August, with a reduction of 2.33 mm. Additionally, July experienced the largest drop in sunshine duration, decreasing by 1.40 hours. These insights highlight the shifting climate patterns in Bamako, emphasizing the urgency for climate action and adaptation strategies.
Climate Change Data Overview for Bamako, Mali
Explore the comprehensive climate change data for Bamako, Mali. This detailed table provides valuable insights into temperature variations, precipitation levels, and seasonal changes influenced by climate change, helping you understand the unique weather patterns of this region.
Temperature °C
| Month | ⌀ 1940 - 1950 | ⌀ 2013 - 2023 | +/- |
|---|---|---|---|
| Jan | 24.19 | 25.22 | 1.03 |
| Feb | 26.27 | 27.91 | 1.65 |
| Mar | 29.13 | 31.02 | 1.88 |
| Apr | 31.38 | 32.94 | 1.56 |
| May | 31.46 | 32.17 | 0.72 |
| Jun | 28.82 | 29.69 | 0.87 |
| Jul | 25.35 | 26.61 | 1.27 |
| Aug | 24.36 | 25.43 | 1.07 |
| Sep | 24.76 | 26.07 | 1.30 |
| Oct | 25.99 | 27.70 | 1.70 |
| Nov | 26.04 | 27.69 | 1.64 |
| Dec | 24.06 | 25.65 | 1.59 |
| ⌀ Month | 26.82 | 28.17 | 1.36 |
Sunshine (h)
| Month | ⌀ 1940 - 1950 | ⌀ 2013 - 2023 | +/- |
|---|---|---|---|
| Jan | 10.53 | 10.38 | -0.15 |
| Feb | 10.60 | 10.55 | -0.05 |
| Mar | 10.89 | 10.64 | -0.25 |
| Apr | 10.90 | 10.74 | -0.16 |
| May | 11.12 | 10.47 | -0.65 |
| Jun | 10.94 | 10.34 | -0.60 |
| Jul | 9.42 | 9.51 | 0.08 |
| Aug | 8.73 | 8.31 | -0.42 |
| Sep | 9.49 | 9.52 | 0.03 |
| Oct | 10.49 | 10.38 | -0.11 |
| Nov | 10.60 | 10.46 | -0.14 |
| Dec | 10.47 | 10.40 | -0.07 |
| ⌀ Month | 10.35 | 10.14 | -0.21 |
Rain (mm)
| Month | ⌀ 1940 - 1950 | ⌀ 2013 - 2023 | +/- |
|---|---|---|---|
| Jan | 0.02 | 0.03 | 0.02 |
| Feb | 0.00 | 0.01 | 0.01 |
| Mar | 0.17 | 0.02 | -0.15 |
| Apr | 0.41 | 0.08 | -0.33 |
| May | 1.07 | 1.12 | 0.05 |
| Jun | 3.57 | 2.64 | -0.93 |
| Jul | 7.31 | 5.90 | -1.40 |
| Aug | 9.33 | 7.00 | -2.33 |
| Sep | 5.76 | 4.70 | -1.06 |
| Oct | 1.62 | 1.35 | -0.27 |
| Nov | 0.03 | 0.02 | -0.01 |
| Dec | 0.04 | 0.00 | -0.04 |
| ⌀ Month | 2.44 | 1.91 | -0.54 |
Snow (mm)
| Month | ⌀ 1940 - 1950 | ⌀ 2013 - 2023 | +/- |
|---|---|---|---|
| Jan | 0.00 | 0.00 | 0.00 |
| Feb | 0.00 | 0.00 | 0.00 |
| Mar | 0.00 | 0.00 | 0.00 |
| Apr | 0.00 | 0.00 | 0.00 |
| May | 0.00 | 0.00 | 0.00 |
| Jun | 0.00 | 0.00 | 0.00 |
| Jul | 0.00 | 0.00 | 0.00 |
| Aug | 0.00 | 0.00 | 0.00 |
| Sep | 0.00 | 0.00 | 0.00 |
| Oct | 0.00 | 0.00 | 0.00 |
| Nov | 0.00 | 0.00 | 0.00 |
| Dec | 0.00 | 0.00 | 0.00 |
| ⌀ Month | 0.00 | 0.00 | 0.00 |