Climate Change Chart of Baghdad, Iraq
Comprehensive Climate Change Chart of Baghdad, Iraq: Monthly Averages and Impact Trends
Explore the changing climate in Baghdad, Iraq, with insights from temperature, rainfall, and sunshine duration data. Discover how the climate has evolved over the years and its impact on the region.
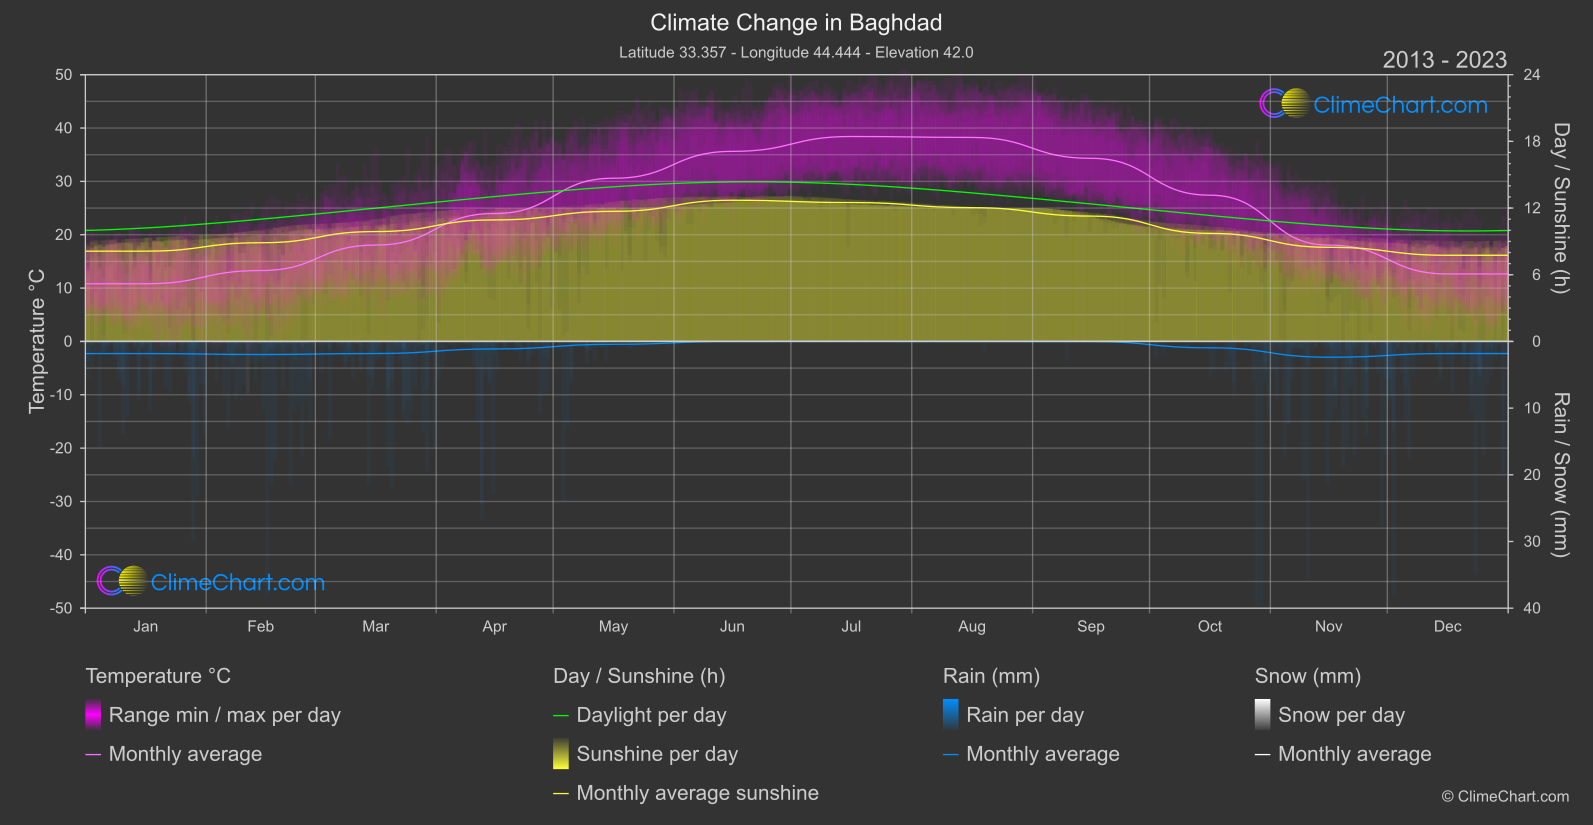
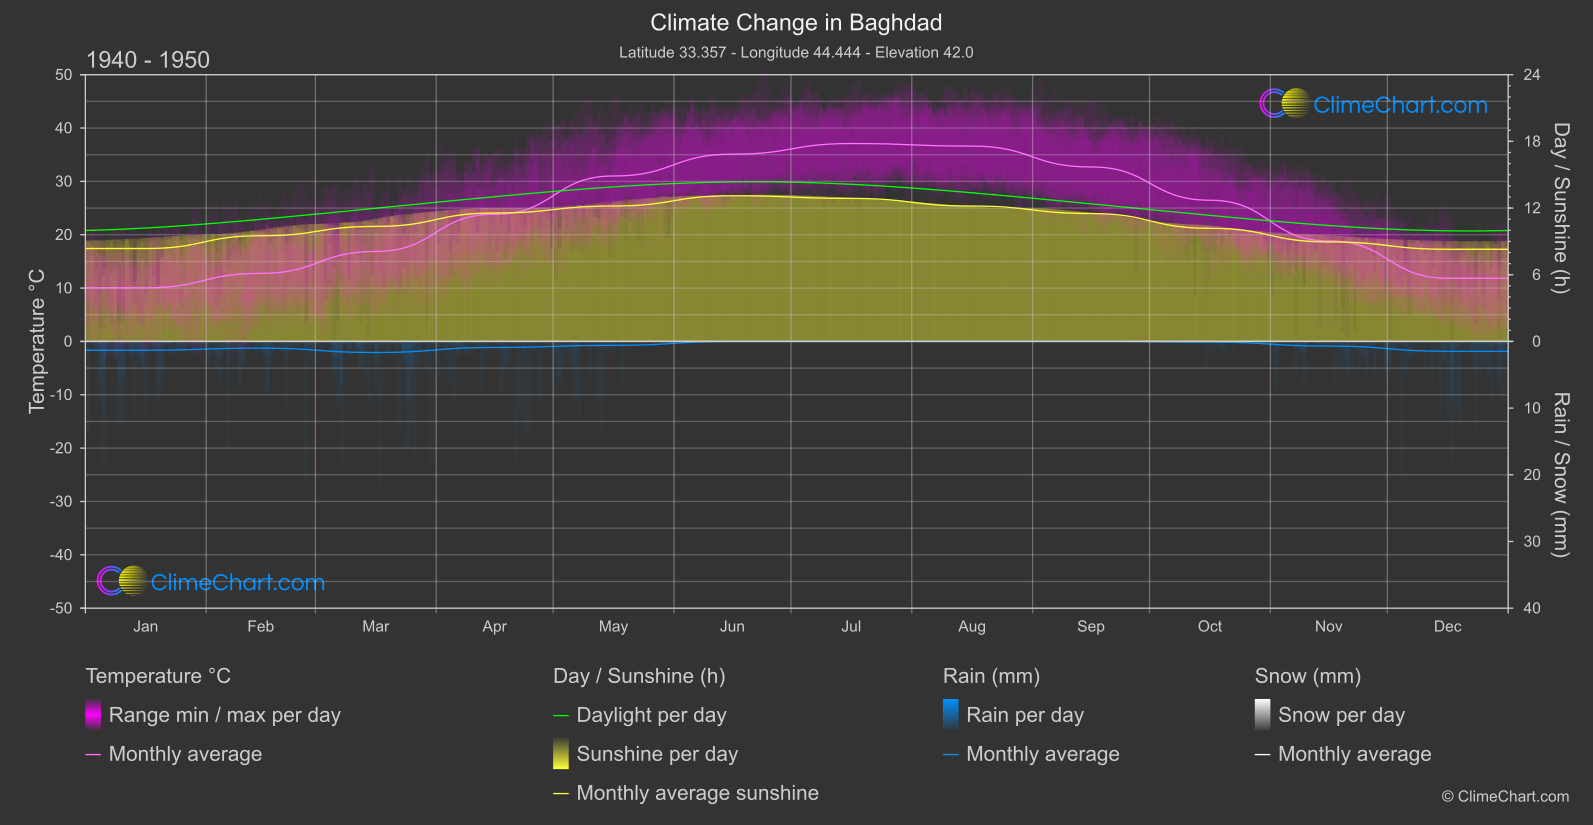
Baghdad, the capital of Iraq, experiences significant changes in temperature, rainfall, and sunshine duration over the years. From the data analysis, it is evident that the month of August shows the highest temperature change, while November exhibits the most significant increase in rainfall. The sunshine duration also varies across the months, with June having the highest change. These fluctuations in climate parameters highlight the ongoing impact of climate change on Baghdad.
Climate Change Data Overview for Baghdad, Iraq
Explore the comprehensive climate change data for Baghdad, Iraq. This detailed table provides valuable insights into temperature variations, precipitation levels, and seasonal changes influenced by climate change, helping you understand the unique weather patterns of this region.
Temperature °C
| Month | ⌀ 1940 - 1950 | ⌀ 2013 - 2023 | +/- |
|---|---|---|---|
| Jan | 10.04 | 10.81 | 0.77 |
| Feb | 12.76 | 13.29 | 0.53 |
| Mar | 16.87 | 18.06 | 1.20 |
| Apr | 23.84 | 23.98 | 0.14 |
| May | 31.01 | 30.59 | -0.42 |
| Jun | 35.10 | 35.63 | 0.52 |
| Jul | 37.10 | 38.41 | 1.32 |
| Aug | 36.61 | 38.24 | 1.63 |
| Sep | 32.71 | 34.32 | 1.62 |
| Oct | 26.47 | 27.42 | 0.95 |
| Nov | 18.84 | 18.05 | -0.79 |
| Dec | 11.84 | 12.64 | 0.80 |
| ⌀ Month | 24.43 | 25.12 | 0.69 |
Sunshine (h)
| Month | ⌀ 1940 - 1950 | ⌀ 2013 - 2023 | +/- |
|---|---|---|---|
| Jan | 8.36 | 8.12 | -0.24 |
| Feb | 9.51 | 8.88 | -0.63 |
| Mar | 10.35 | 9.89 | -0.46 |
| Apr | 11.55 | 10.93 | -0.62 |
| May | 12.18 | 11.70 | -0.48 |
| Jun | 13.11 | 12.70 | -0.41 |
| Jul | 12.87 | 12.50 | -0.37 |
| Aug | 12.18 | 12.04 | -0.15 |
| Sep | 11.51 | 11.28 | -0.23 |
| Oct | 10.18 | 9.72 | -0.46 |
| Nov | 8.95 | 8.47 | -0.49 |
| Dec | 8.29 | 7.75 | -0.54 |
| ⌀ Month | 10.75 | 10.33 | -0.42 |
Rain (mm)
| Month | ⌀ 1940 - 1950 | ⌀ 2013 - 2023 | +/- |
|---|---|---|---|
| Jan | 0.66 | 0.91 | 0.25 |
| Feb | 0.50 | 0.98 | 0.48 |
| Mar | 0.83 | 0.91 | 0.07 |
| Apr | 0.45 | 0.56 | 0.11 |
| May | 0.29 | 0.22 | -0.08 |
| Jun | 0.00 | 0.00 | 0.00 |
| Jul | 0.00 | 0.00 | 0.00 |
| Aug | 0.00 | 0.00 | 0.00 |
| Sep | 0.00 | 0.01 | 0.01 |
| Oct | 0.05 | 0.48 | 0.43 |
| Nov | 0.35 | 1.18 | 0.84 |
| Dec | 0.74 | 0.91 | 0.17 |
| ⌀ Month | 0.32 | 0.51 | 0.19 |
Snow (mm)
| Month | ⌀ 1940 - 1950 | ⌀ 2013 - 2023 | +/- |
|---|---|---|---|
| Jan | 0.00 | 0.00 | 0.00 |
| Feb | 0.00 | 0.00 | 0.00 |
| Mar | 0.00 | 0.00 | 0.00 |
| Apr | 0.00 | 0.00 | 0.00 |
| May | 0.00 | 0.00 | 0.00 |
| Jun | 0.00 | 0.00 | 0.00 |
| Jul | 0.00 | 0.00 | 0.00 |
| Aug | 0.00 | 0.00 | 0.00 |
| Sep | 0.00 | 0.00 | 0.00 |
| Oct | 0.00 | 0.00 | 0.00 |
| Nov | 0.00 | 0.00 | 0.00 |
| Dec | 0.00 | 0.00 | 0.00 |
| ⌀ Month | 0.00 | 0.00 | 0.00 |