Climate Change Chart of Avarua, Cook Islands
Comprehensive Climate Change Chart of Avarua, Cook Islands: Monthly Averages and Impact Trends
Explore the changing climate in Avarua, Cook Islands with insights on temperature, rainfall, and sunshine duration over the years.
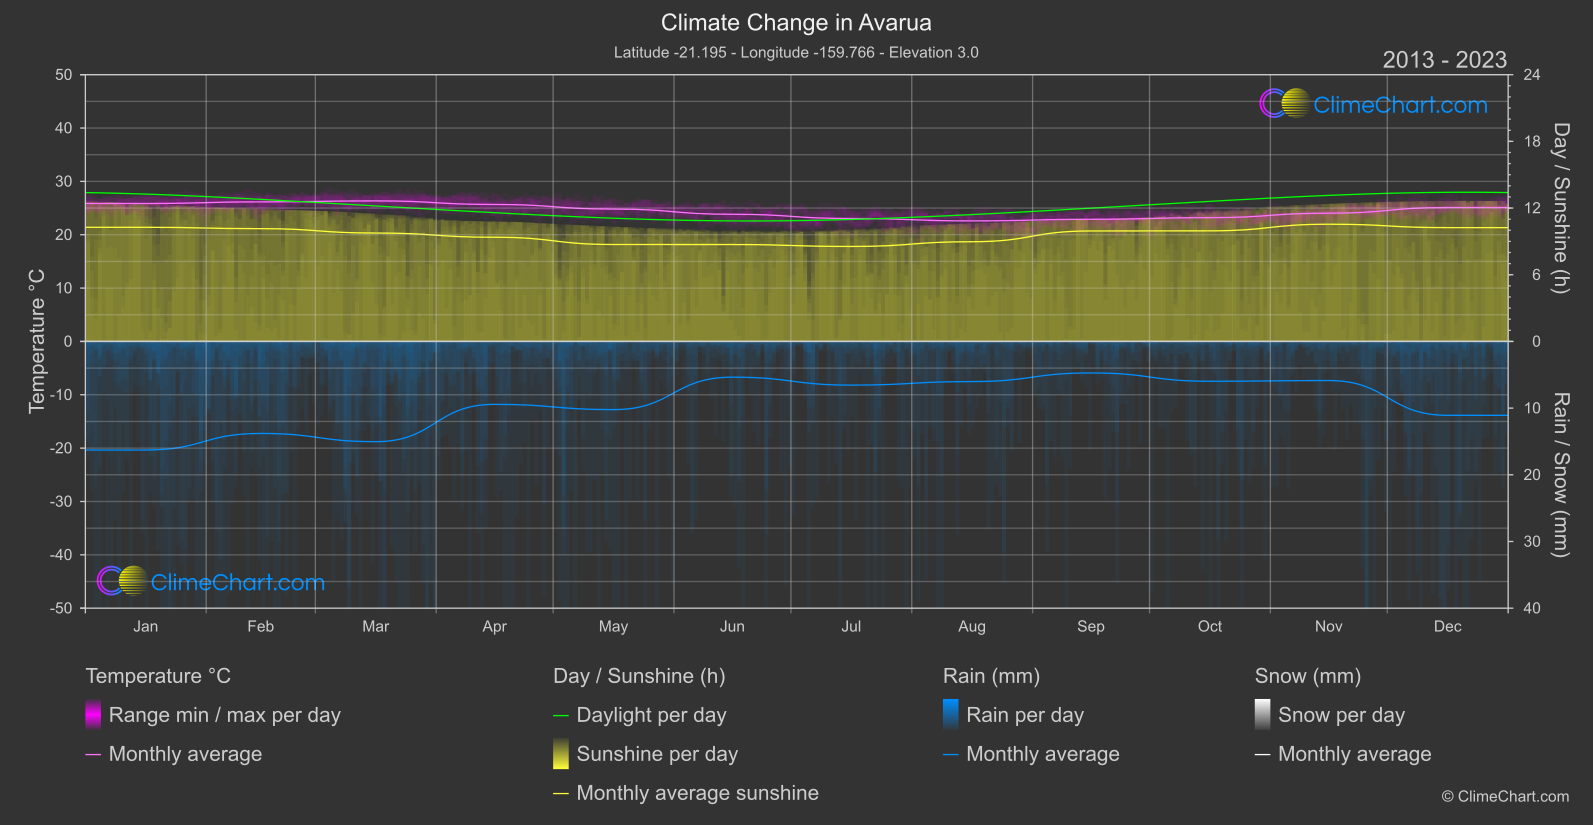
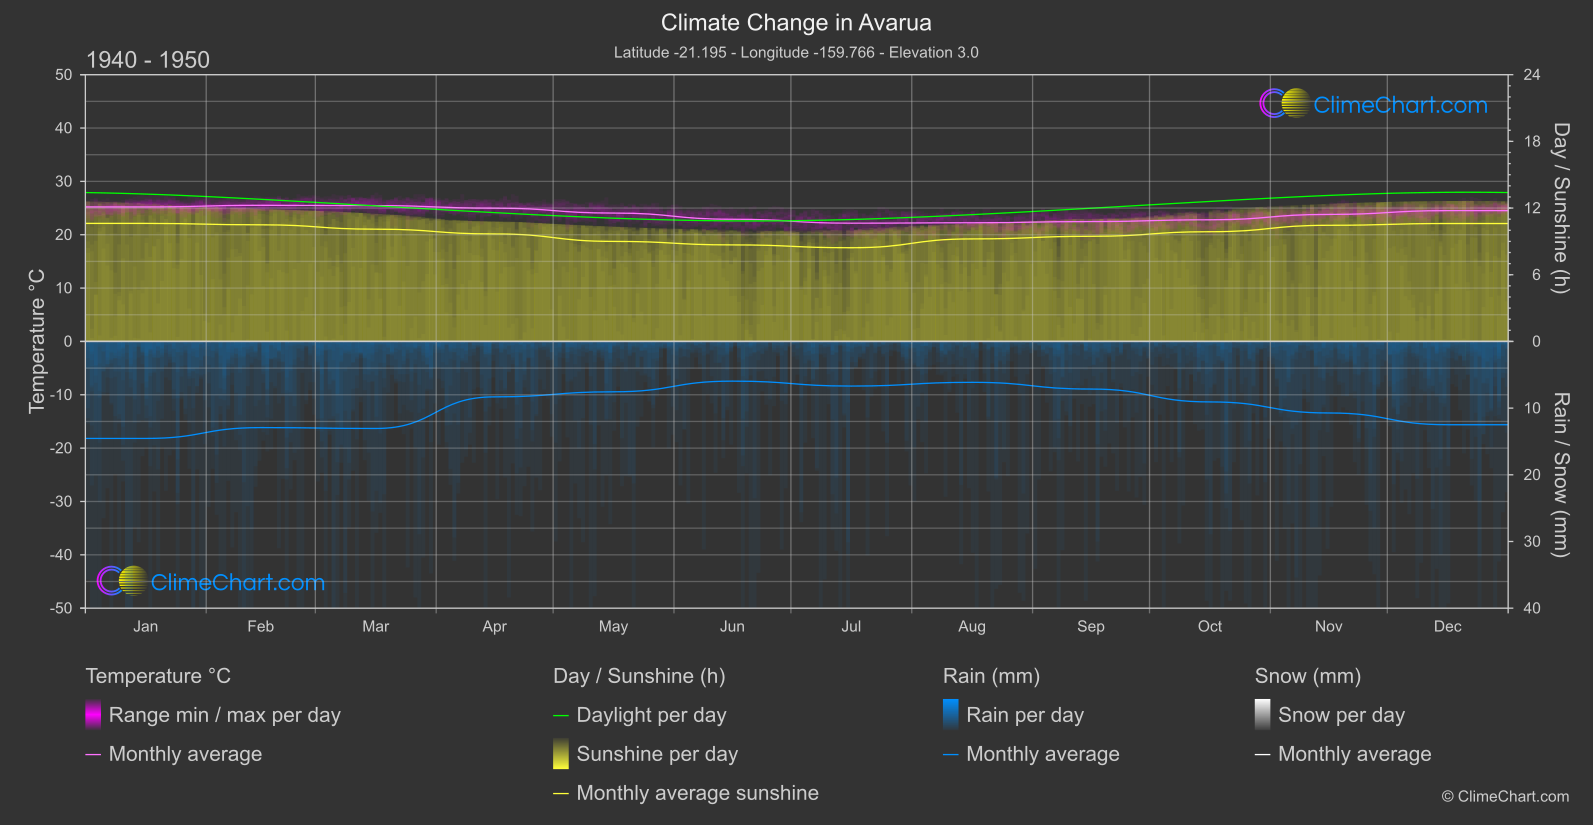
Avarua, Cook Islands, has experienced notable changes in temperature, rainfall, and sunshine duration over the years. From the data comparison between 1940-1950 and 2013-2024, it is evident that there has been a consistent increase in temperature across most months, with the highest change occurring in March. In terms of rainfall, there have been varying trends, with significant decreases observed in September, October, and November. Sunshine duration also shows fluctuations, with notable changes in September and December. These insights provide valuable information on the evolving climate patterns in Avarua.
Climate Change Data Overview for Avarua, Cook Islands
Explore the comprehensive climate change data for Avarua, Cook Islands. This detailed table provides valuable insights into temperature variations, precipitation levels, and seasonal changes influenced by climate change, helping you understand the unique weather patterns of this region.
Temperature °C
| Month | ⌀ 1940 - 1950 | ⌀ 2013 - 2023 | +/- |
|---|---|---|---|
| Jan | 25.21 | 25.86 | 0.64 |
| Feb | 25.51 | 26.16 | 0.64 |
| Mar | 25.46 | 26.34 | 0.88 |
| Apr | 24.98 | 25.67 | 0.69 |
| May | 24.06 | 24.81 | 0.75 |
| Jun | 22.90 | 23.83 | 0.93 |
| Jul | 22.16 | 23.04 | 0.88 |
| Aug | 22.24 | 22.59 | 0.35 |
| Sep | 22.47 | 22.90 | 0.42 |
| Oct | 22.80 | 23.20 | 0.40 |
| Nov | 23.81 | 24.04 | 0.23 |
| Dec | 24.52 | 25.10 | 0.58 |
| ⌀ Month | 23.84 | 24.46 | 0.62 |
Sunshine (h)
| Month | ⌀ 1940 - 1950 | ⌀ 2013 - 2023 | +/- |
|---|---|---|---|
| Jan | 10.62 | 10.27 | -0.35 |
| Feb | 10.49 | 10.15 | -0.35 |
| Mar | 10.10 | 9.75 | -0.35 |
| Apr | 9.67 | 9.37 | -0.30 |
| May | 9.00 | 8.72 | -0.28 |
| Jun | 8.69 | 8.72 | 0.03 |
| Jul | 8.43 | 8.54 | 0.11 |
| Aug | 9.22 | 8.97 | -0.25 |
| Sep | 9.46 | 9.94 | 0.48 |
| Oct | 9.87 | 9.95 | 0.08 |
| Nov | 10.45 | 10.55 | 0.10 |
| Dec | 10.61 | 10.24 | -0.37 |
| ⌀ Month | 9.72 | 9.60 | -0.12 |
Rain (mm)
| Month | ⌀ 1940 - 1950 | ⌀ 2013 - 2023 | +/- |
|---|---|---|---|
| Jan | 7.27 | 8.14 | 0.87 |
| Feb | 6.46 | 6.90 | 0.44 |
| Mar | 6.53 | 7.51 | 0.99 |
| Apr | 4.16 | 4.72 | 0.56 |
| May | 3.78 | 5.11 | 1.33 |
| Jun | 2.98 | 2.68 | -0.30 |
| Jul | 3.35 | 3.27 | -0.07 |
| Aug | 3.07 | 3.01 | -0.06 |
| Sep | 3.57 | 2.36 | -1.21 |
| Oct | 4.54 | 2.99 | -1.55 |
| Nov | 5.36 | 2.93 | -2.43 |
| Dec | 6.24 | 5.54 | -0.70 |
| ⌀ Month | 4.77 | 4.60 | -0.18 |
Snow (mm)
| Month | ⌀ 1940 - 1950 | ⌀ 2013 - 2023 | +/- |
|---|---|---|---|
| Jan | 0.00 | 0.00 | 0.00 |
| Feb | 0.00 | 0.00 | 0.00 |
| Mar | 0.00 | 0.00 | 0.00 |
| Apr | 0.00 | 0.00 | 0.00 |
| May | 0.00 | 0.00 | 0.00 |
| Jun | 0.00 | 0.00 | 0.00 |
| Jul | 0.00 | 0.00 | 0.00 |
| Aug | 0.00 | 0.00 | 0.00 |
| Sep | 0.00 | 0.00 | 0.00 |
| Oct | 0.00 | 0.00 | 0.00 |
| Nov | 0.00 | 0.00 | 0.00 |
| Dec | 0.00 | 0.00 | 0.00 |
| ⌀ Month | 0.00 | 0.00 | 0.00 |