Climate Change Chart of Astana, Kazakhstan
Comprehensive Climate Change Chart of Astana, Kazakhstan: Monthly Averages and Impact Trends
Exploring the climate change in Astana, Kazakhstan reveals intriguing insights into temperature, rainfall, snowfall, and sunshine duration trends over decades.
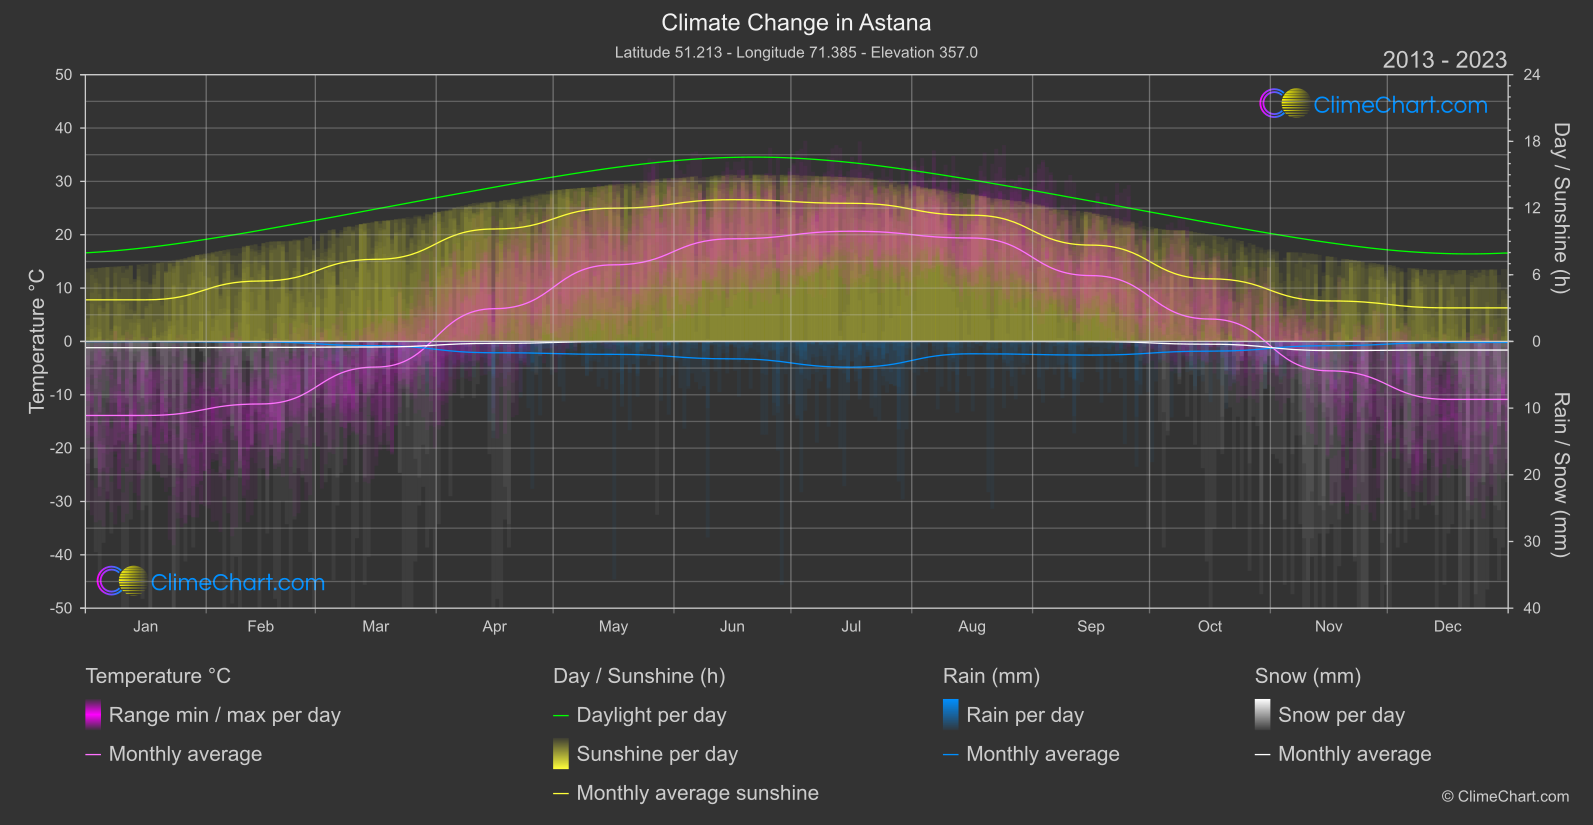
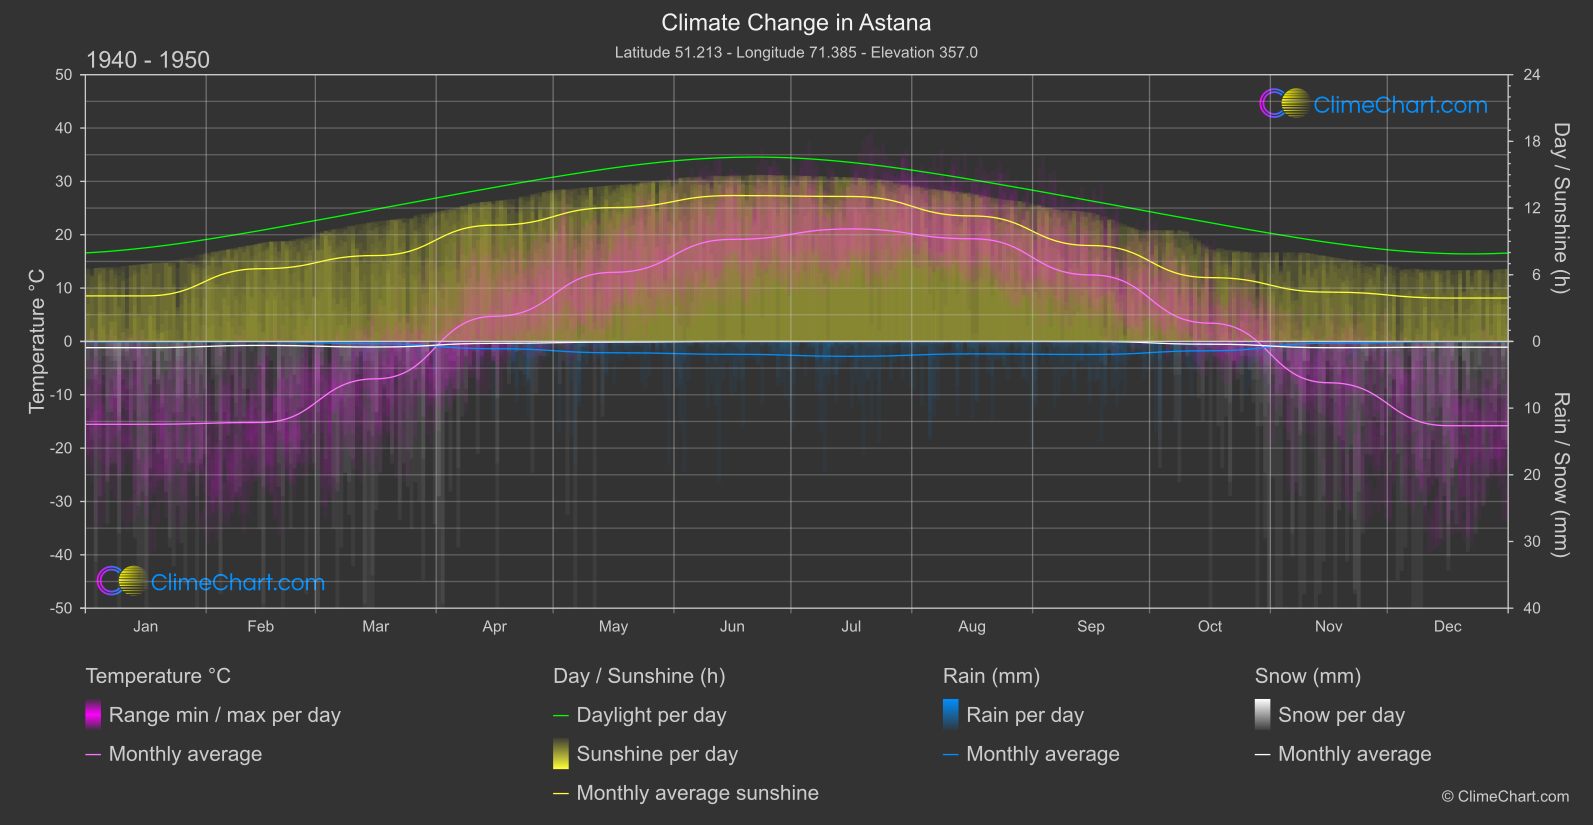
Astana, Kazakhstan experiences notable changes in climate parameters from 1940 to 1950 compared to 2013 to 2024. The data shows varying trends in temperature, rainfall, snowfall, and sunshine duration across different months. For instance, December exhibits the highest temperature change of 4.93°C, while July sees the most significant rainfall increase of 0.81mm. Additionally, snowfall shows a notable uptrend in November with a change of 0.21mm, and sunshine duration experiences a significant decrease in December by 0.88 hours.
Climate Change Data Overview for Astana, Kazakhstan
Explore the comprehensive climate change data for Astana, Kazakhstan. This detailed table provides valuable insights into temperature variations, precipitation levels, and seasonal changes influenced by climate change, helping you understand the unique weather patterns of this region.
Temperature °C
| Month | ⌀ 1940 - 1950 | ⌀ 2013 - 2023 | +/- |
|---|---|---|---|
| Jan | -15.53 | -13.87 | 1.66 |
| Feb | -15.19 | -11.72 | 3.47 |
| Mar | -7.01 | -4.81 | 2.20 |
| Apr | 4.71 | 6.14 | 1.43 |
| May | 12.96 | 14.36 | 1.40 |
| Jun | 19.13 | 19.24 | 0.10 |
| Jul | 21.09 | 20.65 | -0.43 |
| Aug | 19.24 | 19.39 | 0.15 |
| Sep | 12.46 | 12.34 | -0.12 |
| Oct | 3.43 | 4.20 | 0.77 |
| Nov | -7.75 | -5.51 | 2.24 |
| Dec | -15.79 | -10.87 | 4.93 |
| ⌀ Month | 2.65 | 4.13 | 1.48 |
Sunshine (h)
| Month | ⌀ 1940 - 1950 | ⌀ 2013 - 2023 | +/- |
|---|---|---|---|
| Jan | 4.10 | 3.74 | -0.35 |
| Feb | 6.54 | 5.44 | -1.10 |
| Mar | 7.73 | 7.39 | -0.34 |
| Apr | 10.46 | 10.12 | -0.35 |
| May | 12.04 | 11.99 | -0.06 |
| Jun | 13.12 | 12.75 | -0.37 |
| Jul | 13.04 | 12.43 | -0.61 |
| Aug | 11.29 | 11.36 | 0.07 |
| Sep | 8.63 | 8.67 | 0.04 |
| Oct | 5.74 | 5.63 | -0.11 |
| Nov | 4.44 | 3.64 | -0.79 |
| Dec | 3.90 | 3.02 | -0.88 |
| ⌀ Month | 8.42 | 8.01 | -0.41 |
Rain (mm)
| Month | ⌀ 1940 - 1950 | ⌀ 2013 - 2023 | +/- |
|---|---|---|---|
| Jan | 0.03 | 0.01 | -0.02 |
| Feb | 0.02 | 0.05 | 0.03 |
| Mar | 0.17 | 0.32 | 0.15 |
| Apr | 0.54 | 0.85 | 0.30 |
| May | 0.85 | 0.97 | 0.12 |
| Jun | 0.96 | 1.31 | 0.34 |
| Jul | 1.12 | 1.93 | 0.81 |
| Aug | 0.93 | 0.93 | -0.01 |
| Sep | 0.98 | 1.02 | 0.05 |
| Oct | 0.70 | 0.73 | 0.03 |
| Nov | 0.13 | 0.32 | 0.19 |
| Dec | 0.02 | 0.08 | 0.06 |
| ⌀ Month | 0.54 | 0.71 | 0.17 |
Snow (mm)
| Month | ⌀ 1940 - 1950 | ⌀ 2013 - 2023 | +/- |
|---|---|---|---|
| Jan | 0.47 | 0.47 | 0.00 |
| Feb | 0.30 | 0.45 | 0.15 |
| Mar | 0.42 | 0.42 | -0.00 |
| Apr | 0.14 | 0.15 | 0.00 |
| May | 0.05 | 0.01 | -0.04 |
| Jun | 0.00 | 0.00 | 0.00 |
| Jul | 0.00 | 0.00 | 0.00 |
| Aug | 0.00 | 0.00 | 0.00 |
| Sep | 0.00 | 0.01 | 0.01 |
| Oct | 0.21 | 0.21 | 0.00 |
| Nov | 0.47 | 0.68 | 0.21 |
| Dec | 0.43 | 0.65 | 0.22 |
| ⌀ Month | 0.21 | 0.25 | 0.05 |