Climate Change Chart of Aspen Snowmass, USA
Comprehensive Climate Change Chart of Aspen Snowmass, USA: Monthly Averages and Impact Trends
Discover the changing climate in Aspen Snowmass, United States of America with insightful data analysis. Explore the temperature, rainfall, snowfall, and sunshine duration trends from 1940 to 1950 compared to 2013 to 2024.
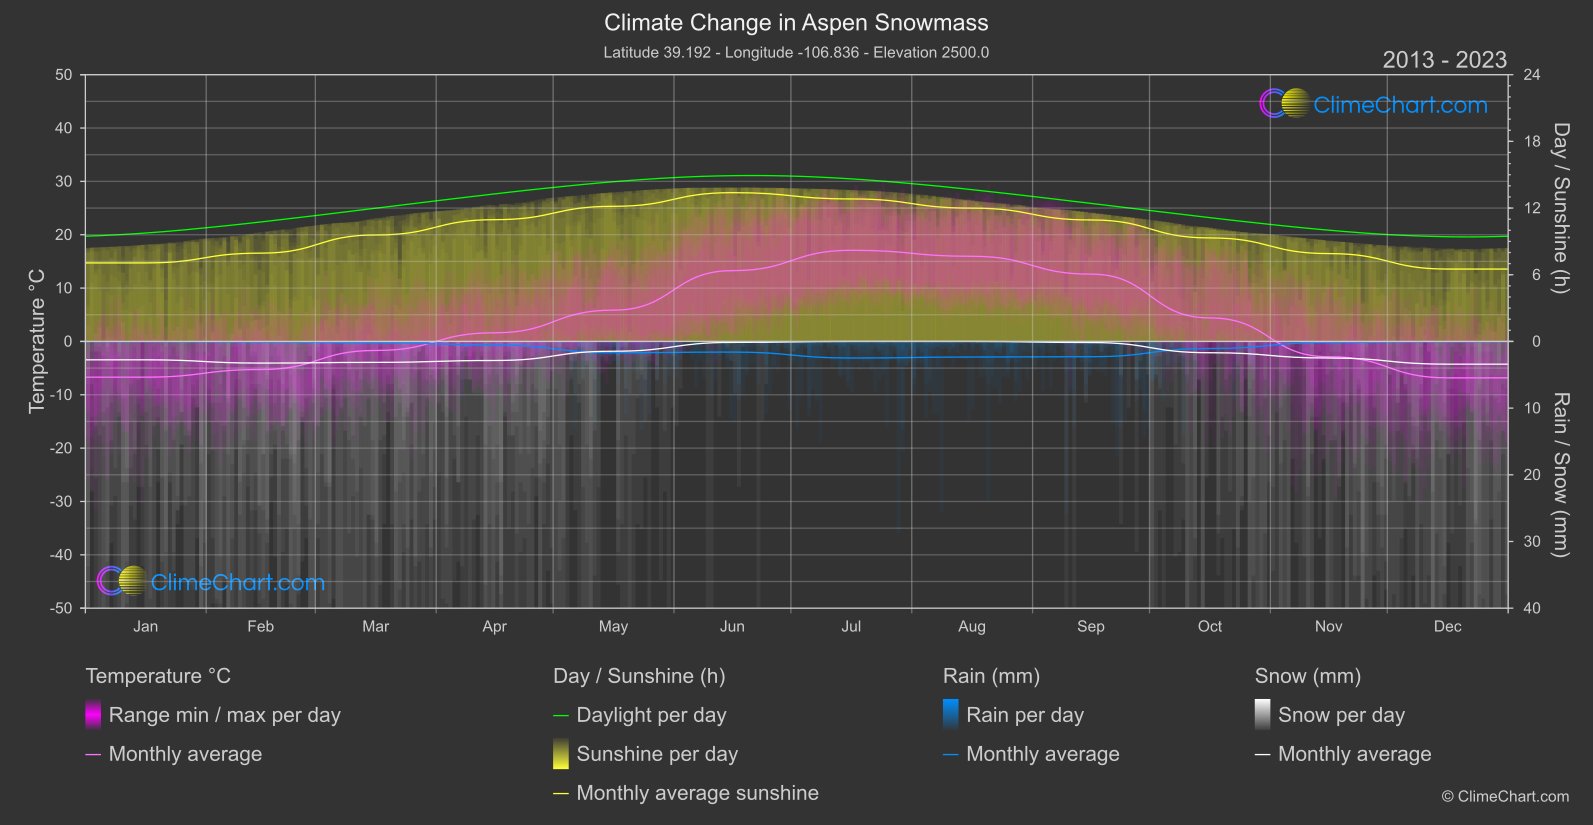

Aspen Snowmass, located in the United States, experiences notable changes in climate over the years. The data from 1940 to 1950 compared to 2013 to 2024 reflects significant shifts in various weather parameters. The temperature analysis shows a general warming trend, with the highest change in November, indicating a substantial increase in temperatures. On the other hand, rainfall patterns exhibit fluctuations, with the most significant change occurring in July, suggesting a notable increase in precipitation during that month. Snowfall data reveals varying trends, with the largest change observed in December, implying a considerable difference in snow accumulation between the two periods. Sunshine duration analysis demonstrates fluctuations, with the most significant change in December, indicating a notable decrease in sunlight hours during that month.
Climate Change Data Overview for Aspen Snowmass, USA
Explore the comprehensive climate change data for Aspen Snowmass, USA. This detailed table provides valuable insights into temperature variations, precipitation levels, and seasonal changes influenced by climate change, helping you understand the unique weather patterns of this region.
Temperature °C
| Month | ⌀ 1940 - 1950 | ⌀ 2013 - 2023 | +/- |
|---|---|---|---|
| Jan | -10.89 | -6.70 | 4.20 |
| Feb | -8.27 | -5.27 | 3.01 |
| Mar | -5.31 | -1.69 | 3.62 |
| Apr | 0.25 | 1.62 | 1.37 |
| May | 4.37 | 5.87 | 1.50 |
| Jun | 10.96 | 13.27 | 2.31 |
| Jul | 15.64 | 17.08 | 1.44 |
| Aug | 14.89 | 15.96 | 1.06 |
| Sep | 10.54 | 12.62 | 2.07 |
| Oct | 3.40 | 4.41 | 1.01 |
| Nov | -7.11 | -2.87 | 4.24 |
| Dec | -9.72 | -6.83 | 2.89 |
| ⌀ Month | 1.56 | 3.96 | 2.39 |
Sunshine (h)
| Month | ⌀ 1940 - 1950 | ⌀ 2013 - 2023 | +/- |
|---|---|---|---|
| Jan | 7.64 | 7.06 | -0.57 |
| Feb | 8.80 | 7.94 | -0.85 |
| Mar | 10.05 | 9.58 | -0.47 |
| Apr | 11.31 | 10.96 | -0.36 |
| May | 12.77 | 12.16 | -0.61 |
| Jun | 13.46 | 13.39 | -0.08 |
| Jul | 13.15 | 12.82 | -0.33 |
| Aug | 12.25 | 11.99 | -0.26 |
| Sep | 11.20 | 10.93 | -0.28 |
| Oct | 9.67 | 9.31 | -0.36 |
| Nov | 8.16 | 7.90 | -0.25 |
| Dec | 7.29 | 6.51 | -0.78 |
| ⌀ Month | 10.48 | 10.05 | -0.43 |
Rain (mm)
| Month | ⌀ 1940 - 1950 | ⌀ 2013 - 2023 | +/- |
|---|---|---|---|
| Jan | 0.01 | 0.01 | 0.00 |
| Feb | 0.02 | 0.04 | 0.02 |
| Mar | 0.09 | 0.10 | 0.01 |
| Apr | 0.50 | 0.26 | -0.24 |
| May | 0.90 | 0.85 | -0.05 |
| Jun | 0.99 | 0.80 | -0.19 |
| Jul | 0.77 | 1.24 | 0.47 |
| Aug | 0.92 | 1.17 | 0.25 |
| Sep | 1.12 | 1.15 | 0.03 |
| Oct | 0.92 | 0.53 | -0.39 |
| Nov | 0.12 | 0.07 | -0.05 |
| Dec | 0.01 | 0.01 | 0.00 |
| ⌀ Month | 0.53 | 0.52 | -0.01 |
Snow (mm)
| Month | ⌀ 1940 - 1950 | ⌀ 2013 - 2023 | +/- |
|---|---|---|---|
| Jan | 1.25 | 1.38 | 0.12 |
| Feb | 1.26 | 1.62 | 0.36 |
| Mar | 1.64 | 1.57 | -0.07 |
| Apr | 1.35 | 1.43 | 0.08 |
| May | 0.44 | 0.73 | 0.29 |
| Jun | 0.04 | 0.07 | 0.03 |
| Jul | 0.00 | 0.00 | 0.00 |
| Aug | 0.00 | 0.00 | 0.00 |
| Sep | 0.08 | 0.08 | 0.01 |
| Oct | 0.53 | 0.85 | 0.31 |
| Nov | 1.15 | 1.24 | 0.10 |
| Dec | 1.27 | 1.70 | 0.43 |
| ⌀ Month | 0.75 | 0.89 | 0.14 |