Climate Change Chart of Arbil, Iraq
Comprehensive Climate Change Chart of Arbil, Iraq: Monthly Averages and Impact Trends
Exploring the changing climate in Arbil, Iraq unveils compelling data on temperature, rainfall, snowfall, and sunshine duration. Discover the significant climate variations from 1940 - 1950 to 2013 - 2024.
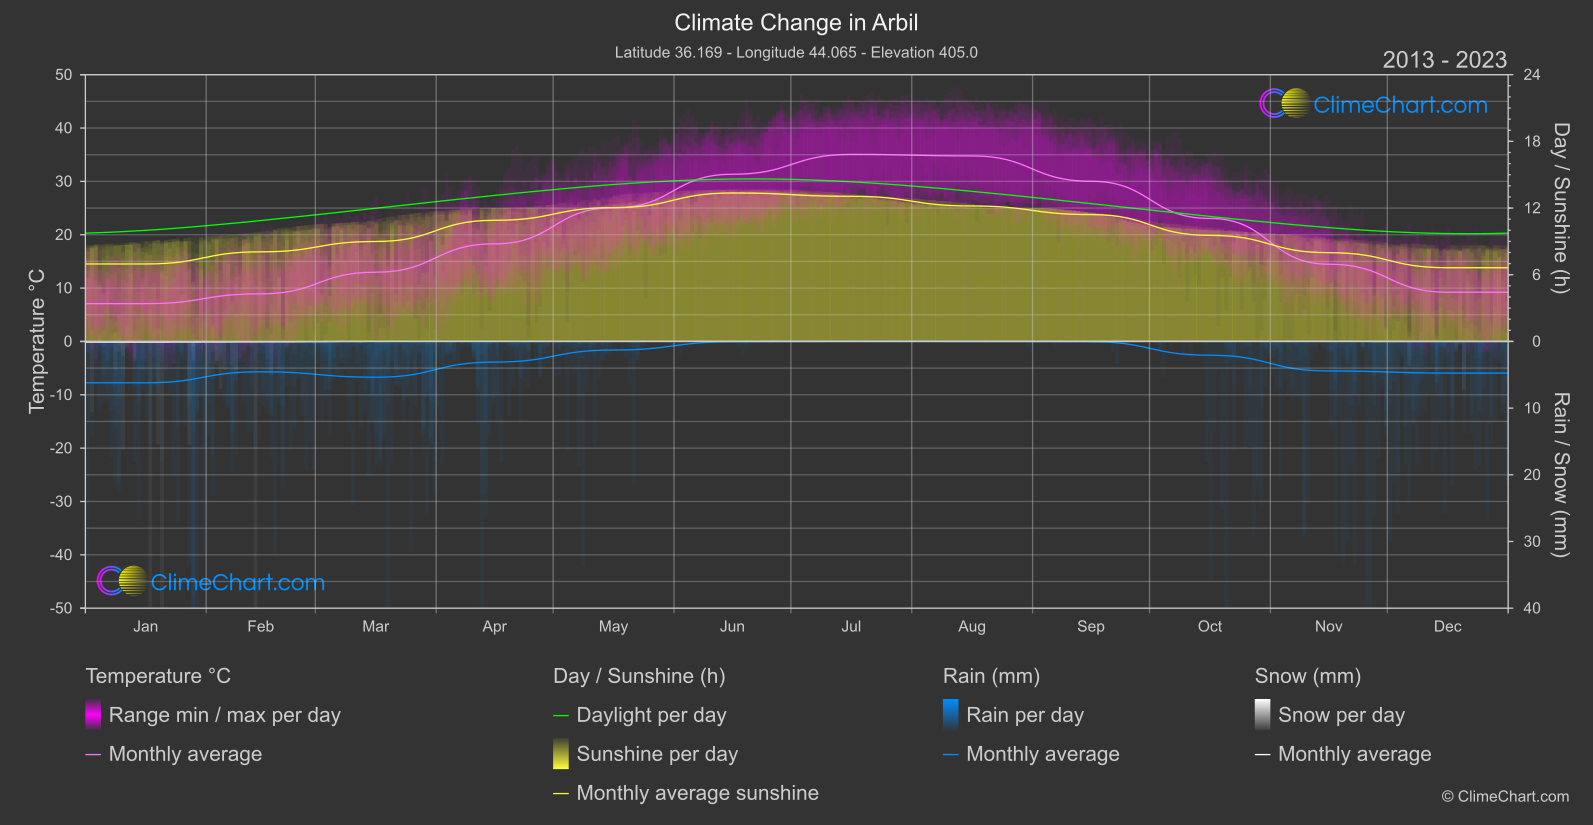
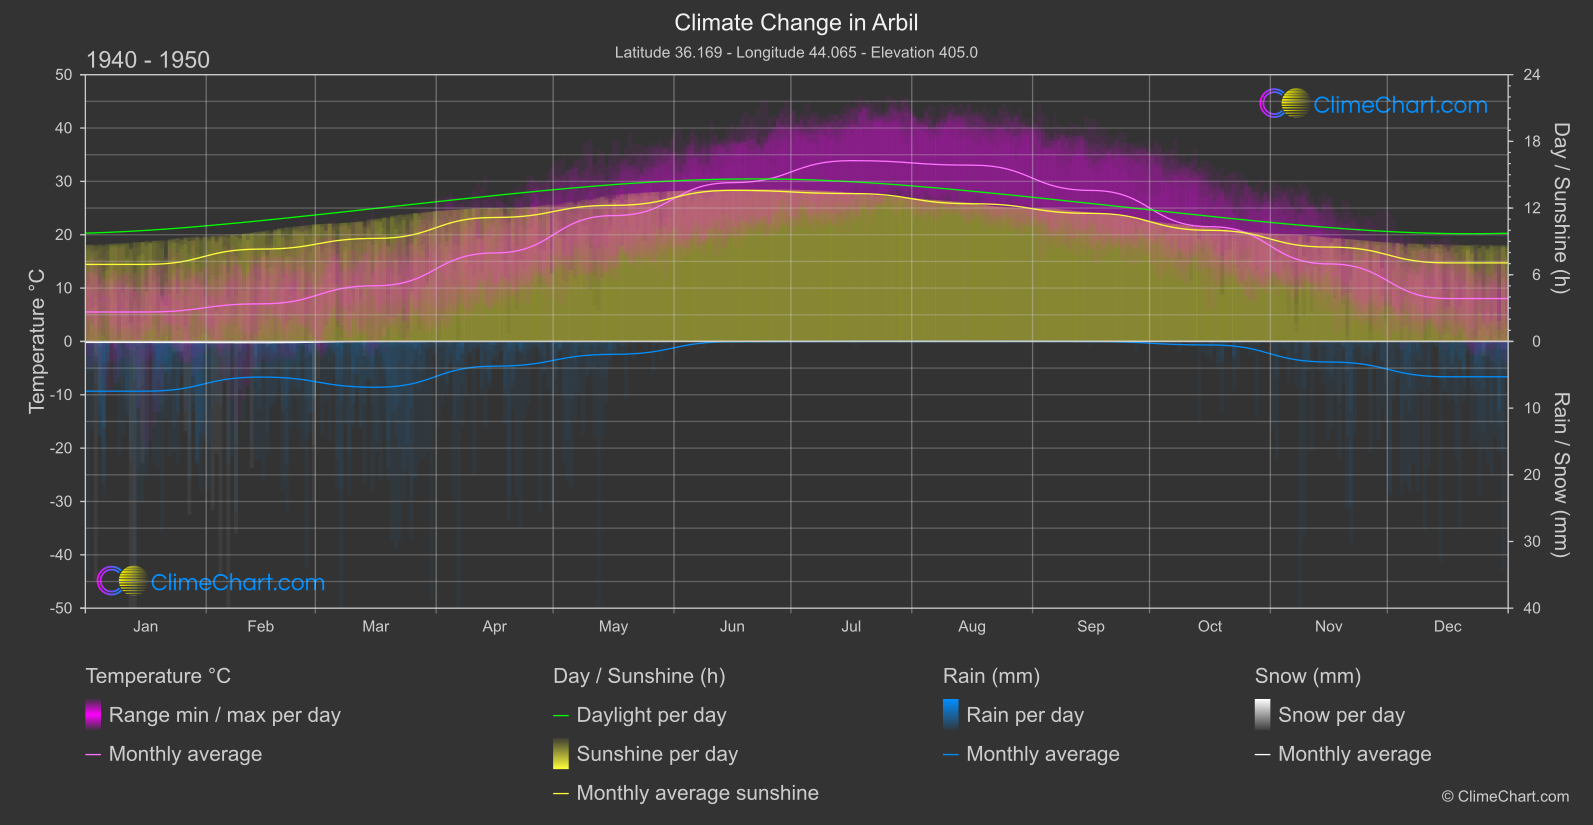
Arbil, Iraq experiences notable shifts in climate variables over the years. The data showcases an increase in average temperatures, a decline in rainfall levels, minimal snowfall, and fluctuations in sunshine duration. Notably, the months of March and August exhibit significant temperature rises, while October sees a substantial increase in rainfall compared to historical records.
Climate Change Data Overview for Arbil, Iraq
Explore the comprehensive climate change data for Arbil, Iraq. This detailed table provides valuable insights into temperature variations, precipitation levels, and seasonal changes influenced by climate change, helping you understand the unique weather patterns of this region.
Temperature °C
| Month | ⌀ 1940 - 1950 | ⌀ 2013 - 2023 | +/- |
|---|---|---|---|
| Jan | 5.52 | 7.08 | 1.56 |
| Feb | 7.04 | 8.92 | 1.88 |
| Mar | 10.44 | 12.98 | 2.54 |
| Apr | 16.58 | 18.29 | 1.71 |
| May | 23.59 | 25.05 | 1.46 |
| Jun | 29.76 | 31.34 | 1.58 |
| Jul | 33.89 | 35.06 | 1.17 |
| Aug | 33.04 | 34.77 | 1.73 |
| Sep | 28.31 | 30.02 | 1.72 |
| Oct | 21.51 | 23.05 | 1.54 |
| Nov | 14.53 | 14.47 | -0.06 |
| Dec | 8.04 | 9.23 | 1.18 |
| ⌀ Month | 19.36 | 20.86 | 1.50 |
Sunshine (h)
| Month | ⌀ 1940 - 1950 | ⌀ 2013 - 2023 | +/- |
|---|---|---|---|
| Jan | 6.93 | 6.97 | 0.04 |
| Feb | 8.31 | 8.06 | -0.25 |
| Mar | 9.27 | 8.99 | -0.28 |
| Apr | 11.15 | 10.90 | -0.25 |
| May | 12.24 | 12.04 | -0.21 |
| Jun | 13.59 | 13.36 | -0.24 |
| Jul | 13.31 | 13.06 | -0.25 |
| Aug | 12.39 | 12.19 | -0.20 |
| Sep | 11.53 | 11.41 | -0.11 |
| Oct | 10.00 | 9.54 | -0.45 |
| Nov | 8.49 | 7.98 | -0.50 |
| Dec | 7.07 | 6.63 | -0.44 |
| ⌀ Month | 10.36 | 10.09 | -0.26 |
Rain (mm)
| Month | ⌀ 1940 - 1950 | ⌀ 2013 - 2023 | +/- |
|---|---|---|---|
| Jan | 3.73 | 3.10 | -0.63 |
| Feb | 2.67 | 2.28 | -0.39 |
| Mar | 3.44 | 2.69 | -0.75 |
| Apr | 1.85 | 1.55 | -0.30 |
| May | 0.97 | 0.64 | -0.32 |
| Jun | 0.02 | 0.03 | 0.01 |
| Jul | 0.00 | 0.00 | -0.00 |
| Aug | 0.00 | 0.01 | 0.01 |
| Sep | 0.01 | 0.03 | 0.02 |
| Oct | 0.26 | 1.03 | 0.77 |
| Nov | 1.54 | 2.21 | 0.67 |
| Dec | 2.65 | 2.37 | -0.28 |
| ⌀ Month | 1.43 | 1.33 | -0.10 |
Snow (mm)
| Month | ⌀ 1940 - 1950 | ⌀ 2013 - 2023 | +/- |
|---|---|---|---|
| Jan | 0.07 | 0.05 | -0.02 |
| Feb | 0.10 | 0.03 | -0.06 |
| Mar | 0.00 | 0.00 | -0.00 |
| Apr | 0.00 | 0.00 | 0.00 |
| May | 0.00 | 0.00 | 0.00 |
| Jun | 0.00 | 0.00 | 0.00 |
| Jul | 0.00 | 0.00 | 0.00 |
| Aug | 0.00 | 0.00 | 0.00 |
| Sep | 0.00 | 0.00 | 0.00 |
| Oct | 0.00 | 0.00 | 0.00 |
| Nov | 0.00 | 0.00 | 0.00 |
| Dec | 0.00 | 0.00 | 0.00 |
| ⌀ Month | 0.01 | 0.01 | -0.01 |