Climate Change Chart of Arapahoe Basin, USA
Comprehensive Climate Change Chart of Arapahoe Basin, USA: Monthly Averages and Impact Trends
Explore the changing climate in Arapahoe Basin, USA, with insightful data on temperature, rainfall, snowfall, and sunshine duration. Discover how the climate has evolved from 1940 to 1950 compared to 2013 to 2024.
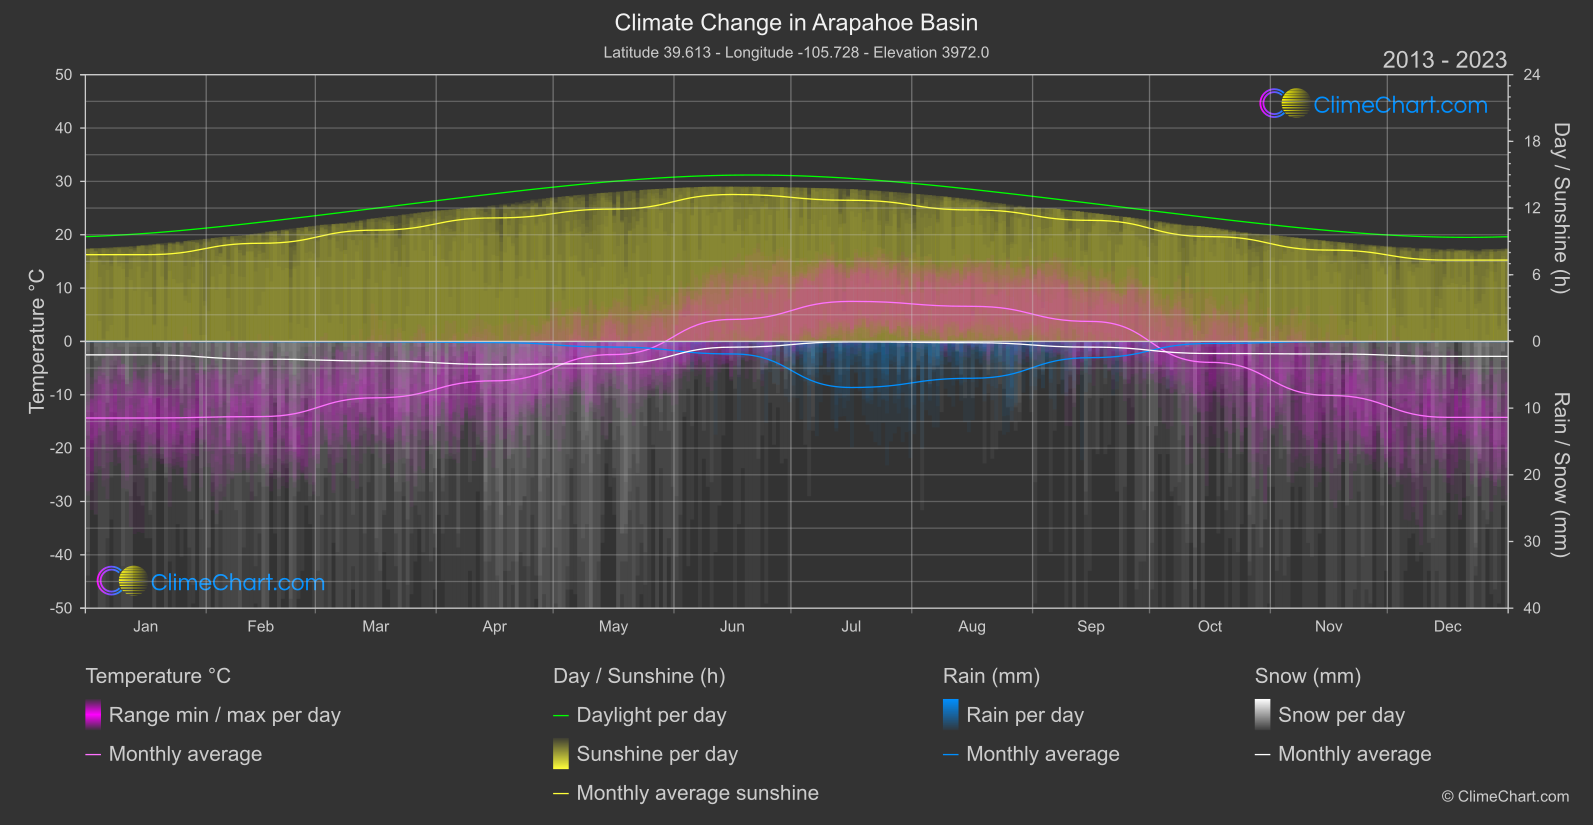
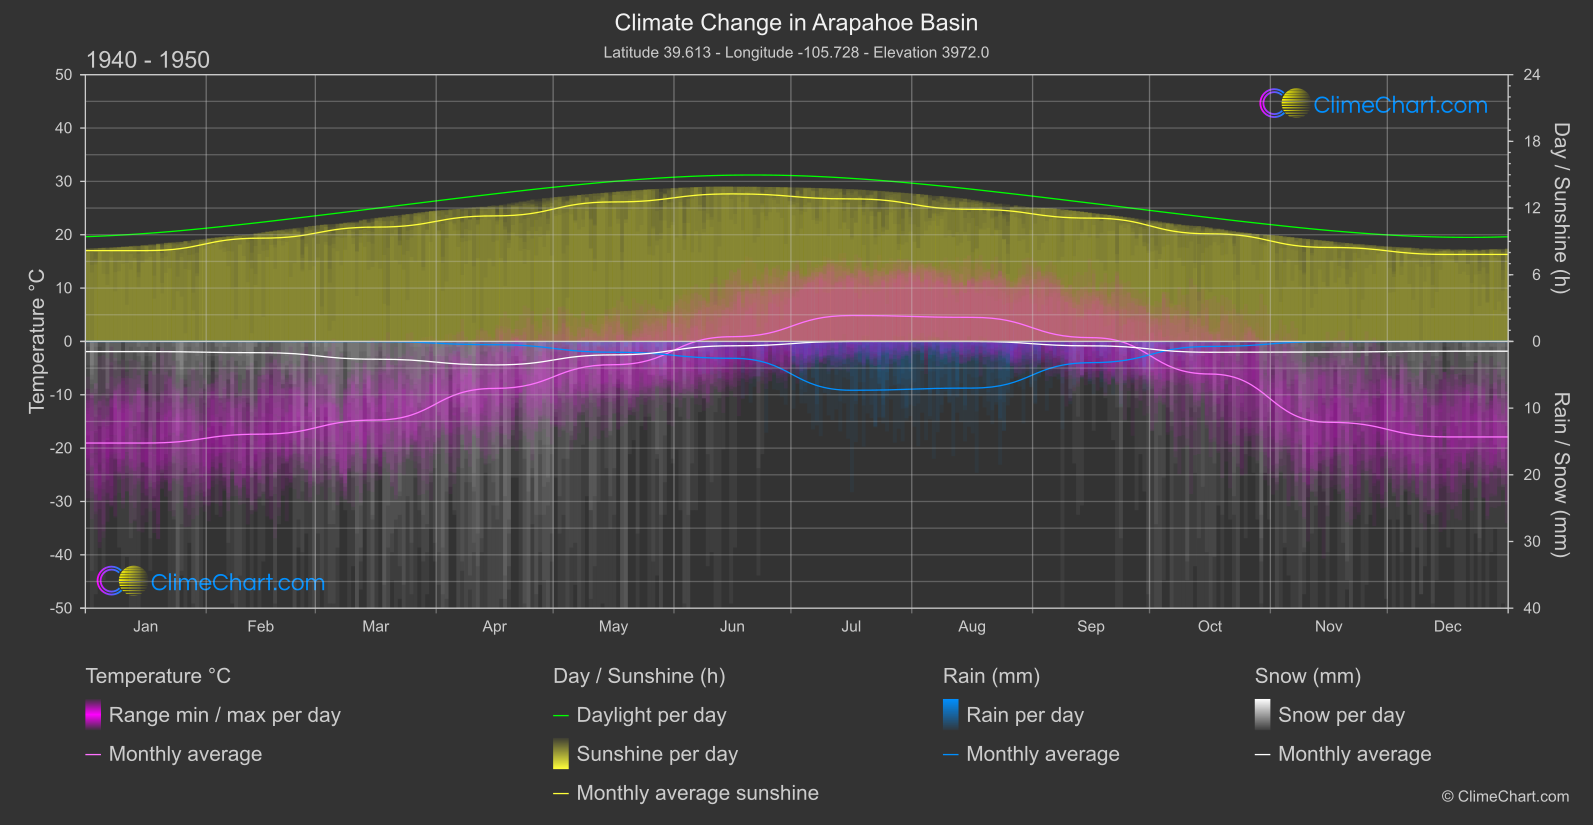
Dive deeper into the climate and weather patterns in Arapahoe Basin, USA. Analyze the temperature changes month by month and discover insights like the month with the highest temperature change or rainfall fluctuation. Explore how snowfall and sunshine duration have evolved over the years, shedding light on the impact of climate change in this region.
Climate Change Data Overview for Arapahoe Basin, USA
Explore the comprehensive climate change data for Arapahoe Basin, USA. This detailed table provides valuable insights into temperature variations, precipitation levels, and seasonal changes influenced by climate change, helping you understand the unique weather patterns of this region.
Temperature °C
| Month | ⌀ 1940 - 1950 | ⌀ 2013 - 2023 | +/- |
|---|---|---|---|
| Jan | -19.04 | -14.35 | 4.69 |
| Feb | -17.38 | -14.09 | 3.30 |
| Mar | -14.74 | -10.57 | 4.17 |
| Apr | -8.81 | -7.38 | 1.42 |
| May | -4.36 | -2.46 | 1.90 |
| Jun | 0.89 | 4.12 | 3.24 |
| Jul | 4.86 | 7.51 | 2.65 |
| Aug | 4.51 | 6.58 | 2.07 |
| Sep | 0.71 | 3.75 | 3.04 |
| Oct | -6.11 | -3.92 | 2.18 |
| Nov | -15.16 | -10.11 | 5.05 |
| Dec | -17.90 | -14.23 | 3.67 |
| ⌀ Month | -7.71 | -4.60 | 3.11 |
Sunshine (h)
| Month | ⌀ 1940 - 1950 | ⌀ 2013 - 2023 | +/- |
|---|---|---|---|
| Jan | 8.17 | 7.81 | -0.36 |
| Feb | 9.29 | 8.83 | -0.46 |
| Mar | 10.29 | 10.01 | -0.27 |
| Apr | 11.30 | 11.11 | -0.18 |
| May | 12.55 | 11.91 | -0.64 |
| Jun | 13.27 | 13.22 | -0.05 |
| Jul | 12.83 | 12.70 | -0.13 |
| Aug | 11.89 | 11.83 | -0.06 |
| Sep | 11.09 | 10.89 | -0.20 |
| Oct | 9.68 | 9.43 | -0.25 |
| Nov | 8.46 | 8.22 | -0.24 |
| Dec | 7.83 | 7.32 | -0.51 |
| ⌀ Month | 10.55 | 10.27 | -0.28 |
Rain (mm)
| Month | ⌀ 1940 - 1950 | ⌀ 2013 - 2023 | +/- |
|---|---|---|---|
| Jan | 0.00 | 0.00 | 0.00 |
| Feb | 0.00 | 0.01 | 0.01 |
| Mar | 0.01 | 0.03 | 0.01 |
| Apr | 0.25 | 0.08 | -0.16 |
| May | 0.81 | 0.42 | -0.39 |
| Jun | 1.26 | 0.94 | -0.33 |
| Jul | 3.66 | 3.45 | -0.21 |
| Aug | 3.50 | 2.76 | -0.74 |
| Sep | 1.59 | 1.22 | -0.38 |
| Oct | 0.38 | 0.15 | -0.22 |
| Nov | 0.01 | 0.01 | 0.01 |
| Dec | 0.00 | 0.01 | 0.00 |
| ⌀ Month | 0.96 | 0.76 | -0.20 |
Snow (mm)
| Month | ⌀ 1940 - 1950 | ⌀ 2013 - 2023 | +/- |
|---|---|---|---|
| Jan | 0.76 | 1.01 | 0.24 |
| Feb | 0.85 | 1.33 | 0.48 |
| Mar | 1.33 | 1.46 | 0.13 |
| Apr | 1.76 | 1.72 | -0.04 |
| May | 1.01 | 1.67 | 0.66 |
| Jun | 0.33 | 0.43 | 0.10 |
| Jul | 0.00 | 0.03 | 0.03 |
| Aug | 0.00 | 0.10 | 0.10 |
| Sep | 0.33 | 0.43 | 0.10 |
| Oct | 0.81 | 0.91 | 0.09 |
| Nov | 0.79 | 0.94 | 0.15 |
| Dec | 0.73 | 1.12 | 0.39 |
| ⌀ Month | 0.73 | 0.93 | 0.20 |