Climate Change Chart of Antananarivo, Madagascar
Comprehensive Climate Change Chart of Antananarivo, Madagascar: Monthly Averages and Impact Trends
Exploring the changing climate in Antananarivo, Madagascar reveals significant shifts in temperature, rainfall, and sunshine duration over the years.
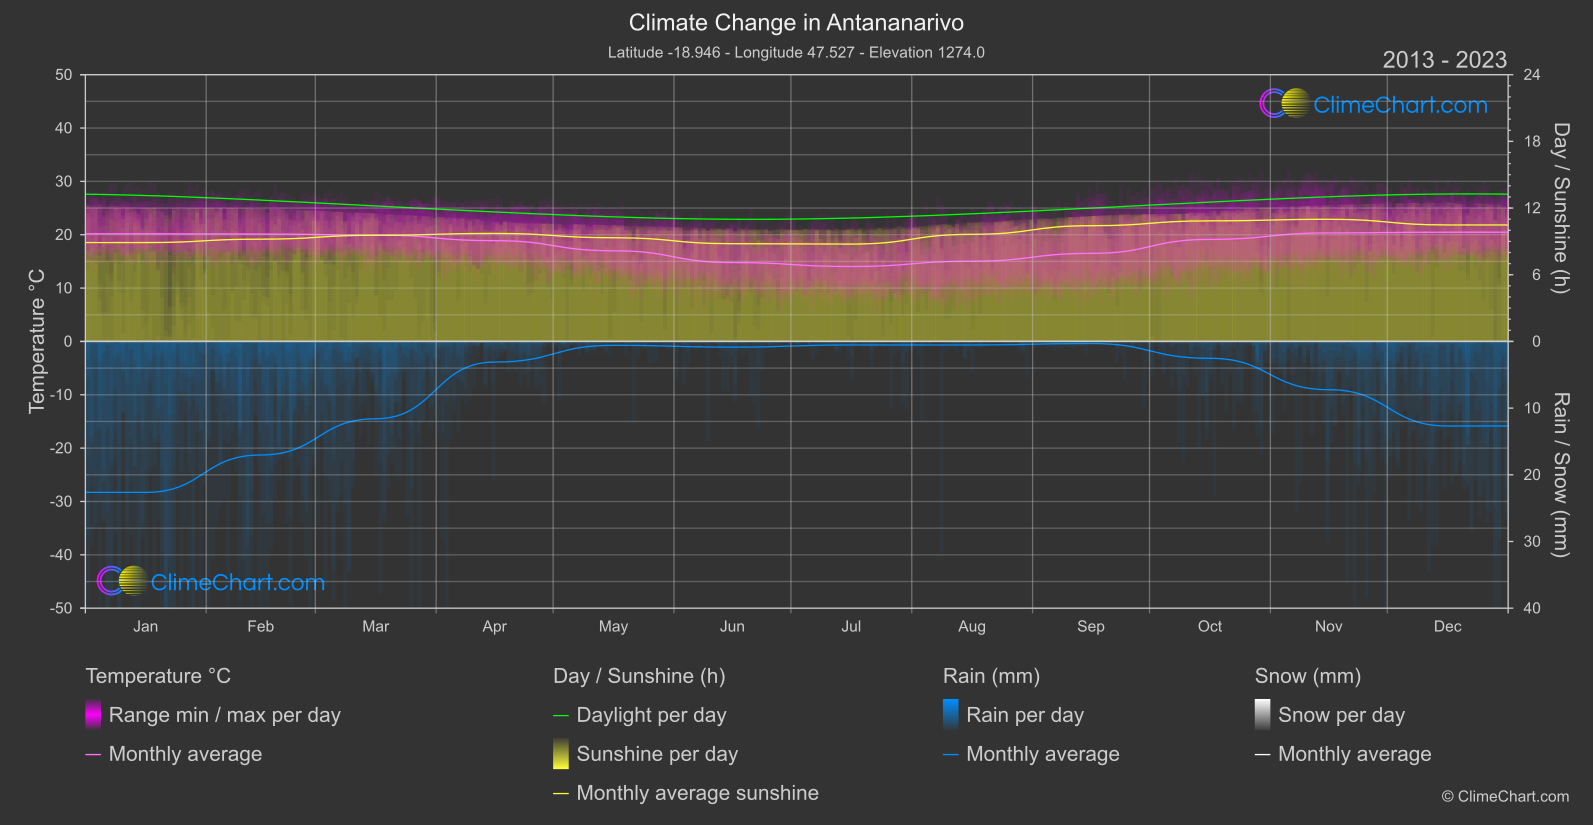
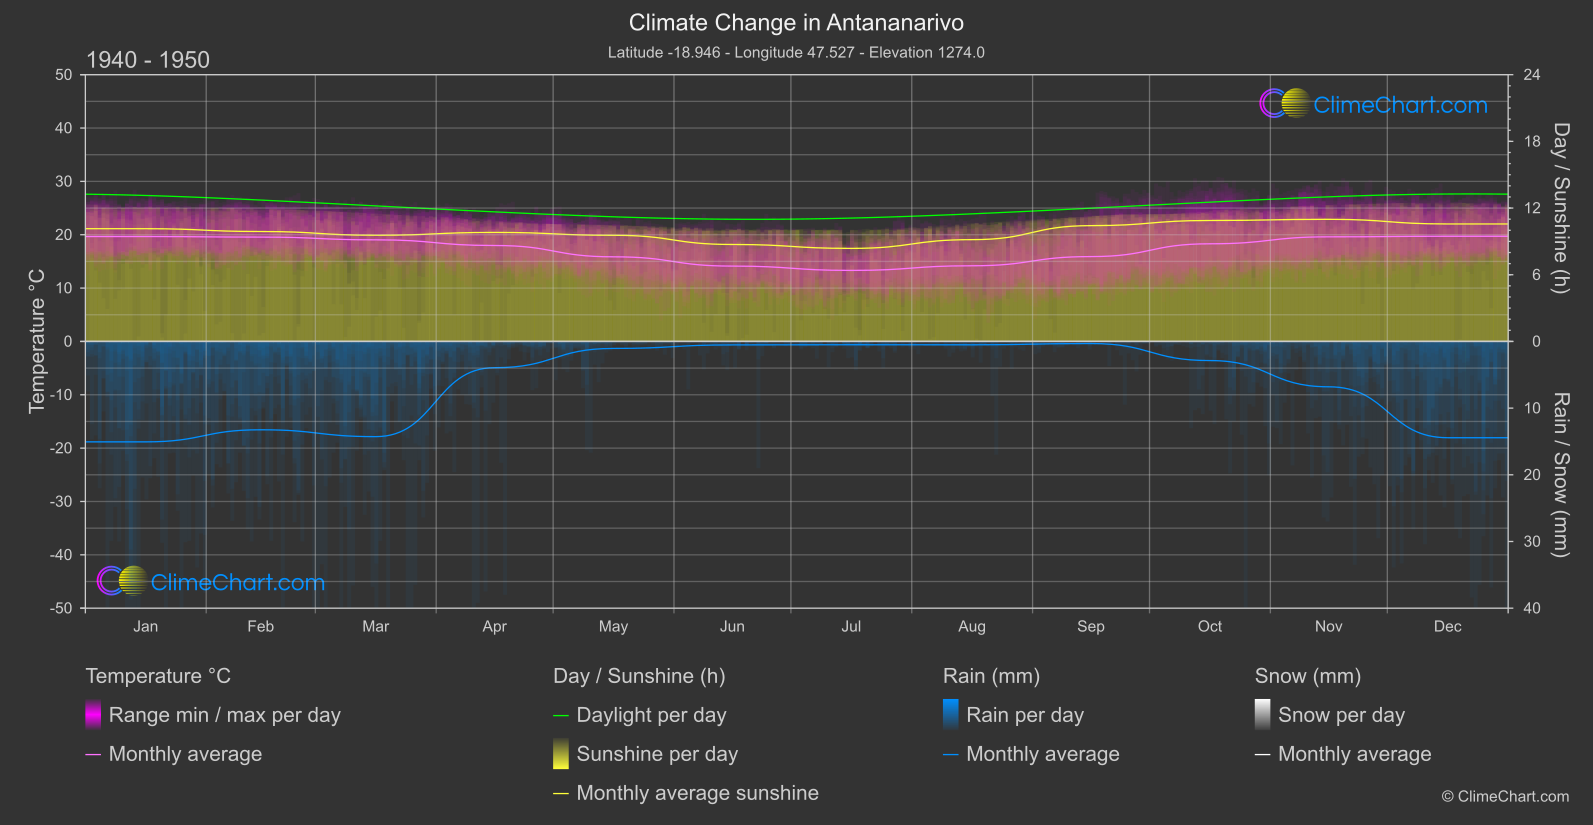
Antananarivo, the capital of Madagascar, has experienced notable climate changes. The data comparison from 1940-1950 to 2013-2024 indicates an overall increase in temperatures and a variation in rainfall patterns. Notably, May shows the highest temperature change of 1.135°C, while January exhibits the largest increase in rainfall of 3.786mm. These changes highlight the impact of climate change on Antananarivo's weather patterns.
Climate Change Data Overview for Antananarivo, Madagascar
Explore the comprehensive climate change data for Antananarivo, Madagascar. This detailed table provides valuable insights into temperature variations, precipitation levels, and seasonal changes influenced by climate change, helping you understand the unique weather patterns of this region.
Temperature °C
| Month | ⌀ 1940 - 1950 | ⌀ 2013 - 2023 | +/- |
|---|---|---|---|
| Jan | 19.66 | 20.18 | 0.52 |
| Feb | 19.56 | 20.13 | 0.58 |
| Mar | 19.04 | 19.94 | 0.89 |
| Apr | 17.98 | 18.88 | 0.90 |
| May | 15.86 | 16.99 | 1.14 |
| Jun | 14.12 | 14.79 | 0.66 |
| Jul | 13.31 | 14.05 | 0.73 |
| Aug | 14.18 | 15.04 | 0.86 |
| Sep | 15.90 | 16.50 | 0.60 |
| Oct | 18.30 | 19.13 | 0.83 |
| Nov | 19.61 | 20.34 | 0.73 |
| Dec | 19.71 | 20.47 | 0.76 |
| ⌀ Month | 17.27 | 18.04 | 0.77 |
Sunshine (h)
| Month | ⌀ 1940 - 1950 | ⌀ 2013 - 2023 | +/- |
|---|---|---|---|
| Jan | 10.14 | 8.89 | -1.25 |
| Feb | 9.89 | 9.20 | -0.69 |
| Mar | 9.55 | 9.55 | -0.00 |
| Apr | 9.81 | 9.72 | -0.09 |
| May | 9.55 | 9.33 | -0.22 |
| Jun | 8.72 | 8.79 | 0.07 |
| Jul | 8.37 | 8.76 | 0.39 |
| Aug | 9.16 | 9.64 | 0.48 |
| Sep | 10.42 | 10.41 | -0.01 |
| Oct | 10.88 | 10.85 | -0.03 |
| Nov | 10.99 | 10.99 | 0.00 |
| Dec | 10.57 | 10.48 | -0.09 |
| ⌀ Month | 9.84 | 9.72 | -0.12 |
Rain (mm)
| Month | ⌀ 1940 - 1950 | ⌀ 2013 - 2023 | +/- |
|---|---|---|---|
| Jan | 7.53 | 11.32 | 3.79 |
| Feb | 6.62 | 8.51 | 1.89 |
| Mar | 7.14 | 5.80 | -1.34 |
| Apr | 1.97 | 1.55 | -0.42 |
| May | 0.52 | 0.29 | -0.23 |
| Jun | 0.26 | 0.43 | 0.17 |
| Jul | 0.25 | 0.27 | 0.02 |
| Aug | 0.25 | 0.26 | 0.01 |
| Sep | 0.16 | 0.16 | -0.00 |
| Oct | 1.43 | 1.27 | -0.17 |
| Nov | 3.40 | 3.62 | 0.22 |
| Dec | 7.22 | 6.34 | -0.88 |
| ⌀ Month | 3.06 | 3.32 | 0.25 |
Snow (mm)
| Month | ⌀ 1940 - 1950 | ⌀ 2013 - 2023 | +/- |
|---|---|---|---|
| Jan | 0.00 | 0.00 | 0.00 |
| Feb | 0.00 | 0.00 | 0.00 |
| Mar | 0.00 | 0.00 | 0.00 |
| Apr | 0.00 | 0.00 | 0.00 |
| May | 0.00 | 0.00 | 0.00 |
| Jun | 0.00 | 0.00 | 0.00 |
| Jul | 0.00 | 0.00 | 0.00 |
| Aug | 0.00 | 0.00 | 0.00 |
| Sep | 0.00 | 0.00 | 0.00 |
| Oct | 0.00 | 0.00 | 0.00 |
| Nov | 0.00 | 0.00 | 0.00 |
| Dec | 0.00 | 0.00 | 0.00 |
| ⌀ Month | 0.00 | 0.00 | 0.00 |