Climate Change Chart of Antalya, Türkiye
Comprehensive Climate Change Chart of Antalya, Türkiye: Monthly Averages and Impact Trends
Exploring the climate change data in Antalya, Türkiye reveals significant trends in temperature, rainfall, snowfall, and sunshine duration over the years.
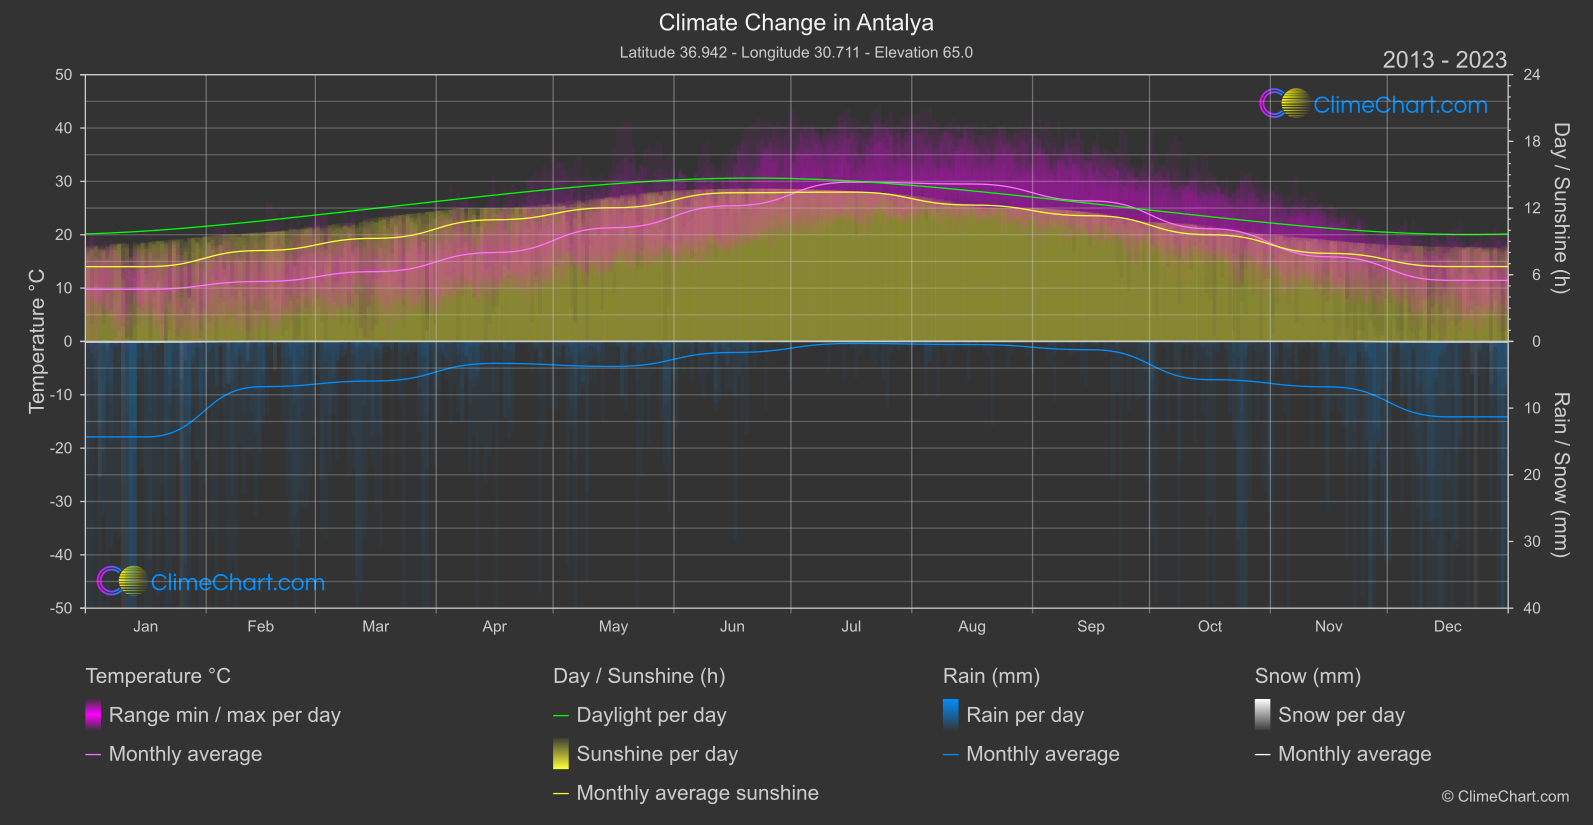
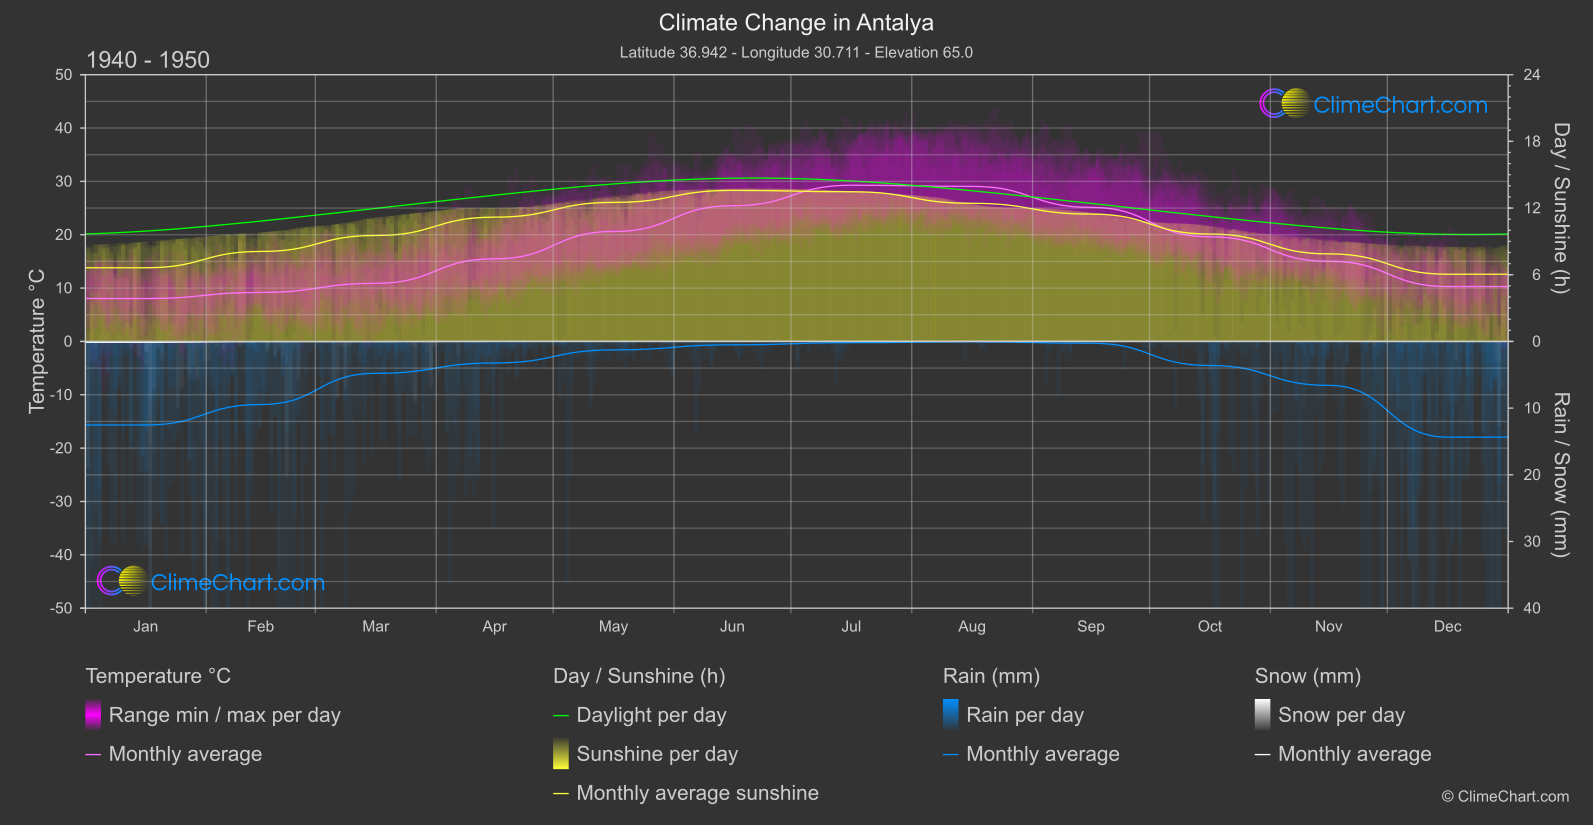
Antalya, Türkiye experiences changes in climate variables such as temperature, rainfall, snowfall, and sunshine duration. Analyzing the data from 1940 to 1950 and comparing it to the period from 2013 to 2024, it is evident that temperatures have generally increased across most months, with September showing the highest temperature change of 1.20°C. In terms of rainfall, there are fluctuations with some months experiencing an increase in rainfall like May with a change of 1.24 mm, while other months like December have seen a decrease in rainfall by 1.53 mm. Snowfall has significantly decreased in most months, with April and May having no snowfall recorded in recent years. Sunshine duration has also shown variations, with December having the highest increase in sunshine duration by 0.69 hours.
Climate Change Data Overview for Antalya, Türkiye
Explore the comprehensive climate change data for Antalya, Türkiye. This detailed table provides valuable insights into temperature variations, precipitation levels, and seasonal changes influenced by climate change, helping you understand the unique weather patterns of this region.
Temperature °C
| Month | ⌀ 1940 - 1950 | ⌀ 2013 - 2023 | +/- |
|---|---|---|---|
| Jan | 8.04 | 9.77 | 1.73 |
| Feb | 9.19 | 11.24 | 2.05 |
| Mar | 10.88 | 13.09 | 2.20 |
| Apr | 15.49 | 16.66 | 1.17 |
| May | 20.61 | 21.31 | 0.70 |
| Jun | 25.43 | 25.43 | 0.00 |
| Jul | 29.28 | 29.86 | 0.59 |
| Aug | 29.06 | 29.51 | 0.45 |
| Sep | 25.13 | 26.32 | 1.20 |
| Oct | 19.61 | 21.12 | 1.51 |
| Nov | 15.02 | 15.87 | 0.85 |
| Dec | 10.29 | 11.45 | 1.16 |
| ⌀ Month | 18.17 | 19.30 | 1.13 |
Sunshine (h)
| Month | ⌀ 1940 - 1950 | ⌀ 2013 - 2023 | +/- |
|---|---|---|---|
| Jan | 6.63 | 6.73 | 0.10 |
| Feb | 8.09 | 8.18 | 0.08 |
| Mar | 9.53 | 9.28 | -0.26 |
| Apr | 11.18 | 10.95 | -0.24 |
| May | 12.51 | 12.03 | -0.48 |
| Jun | 13.59 | 13.38 | -0.21 |
| Jul | 13.47 | 13.44 | -0.03 |
| Aug | 12.43 | 12.27 | -0.16 |
| Sep | 11.46 | 11.31 | -0.14 |
| Oct | 9.66 | 9.60 | -0.06 |
| Nov | 7.88 | 7.93 | 0.05 |
| Dec | 6.05 | 6.74 | 0.69 |
| ⌀ Month | 10.21 | 10.15 | -0.05 |
Rain (mm)
| Month | ⌀ 1940 - 1950 | ⌀ 2013 - 2023 | +/- |
|---|---|---|---|
| Jan | 6.26 | 7.16 | 0.90 |
| Feb | 4.73 | 3.39 | -1.33 |
| Mar | 2.39 | 2.96 | 0.57 |
| Apr | 1.62 | 1.64 | 0.03 |
| May | 0.63 | 1.87 | 1.24 |
| Jun | 0.25 | 0.83 | 0.58 |
| Jul | 0.09 | 0.15 | 0.06 |
| Aug | 0.03 | 0.23 | 0.20 |
| Sep | 0.13 | 0.62 | 0.49 |
| Oct | 1.80 | 2.87 | 1.06 |
| Nov | 3.30 | 3.41 | 0.11 |
| Dec | 7.18 | 5.65 | -1.53 |
| ⌀ Month | 2.37 | 2.57 | 0.20 |
Snow (mm)
| Month | ⌀ 1940 - 1950 | ⌀ 2013 - 2023 | +/- |
|---|---|---|---|
| Jan | 0.06 | 0.05 | -0.02 |
| Feb | 0.02 | 0.00 | -0.01 |
| Mar | 0.01 | 0.00 | -0.01 |
| Apr | 0.00 | 0.00 | -0.00 |
| May | 0.00 | 0.00 | 0.00 |
| Jun | 0.00 | 0.00 | 0.00 |
| Jul | 0.00 | 0.00 | 0.00 |
| Aug | 0.00 | 0.00 | 0.00 |
| Sep | 0.00 | 0.00 | 0.00 |
| Oct | 0.00 | 0.00 | 0.00 |
| Nov | 0.00 | 0.00 | 0.00 |
| Dec | 0.01 | 0.04 | 0.03 |
| ⌀ Month | 0.01 | 0.01 | -0.00 |