Climate Change Chart of Annapolis, USA
Comprehensive Climate Change Chart of Annapolis, USA: Monthly Averages and Impact Trends
Explore the changing climate in Annapolis, USA with insights from temperature, rainfall, snowfall, and sunshine duration data.
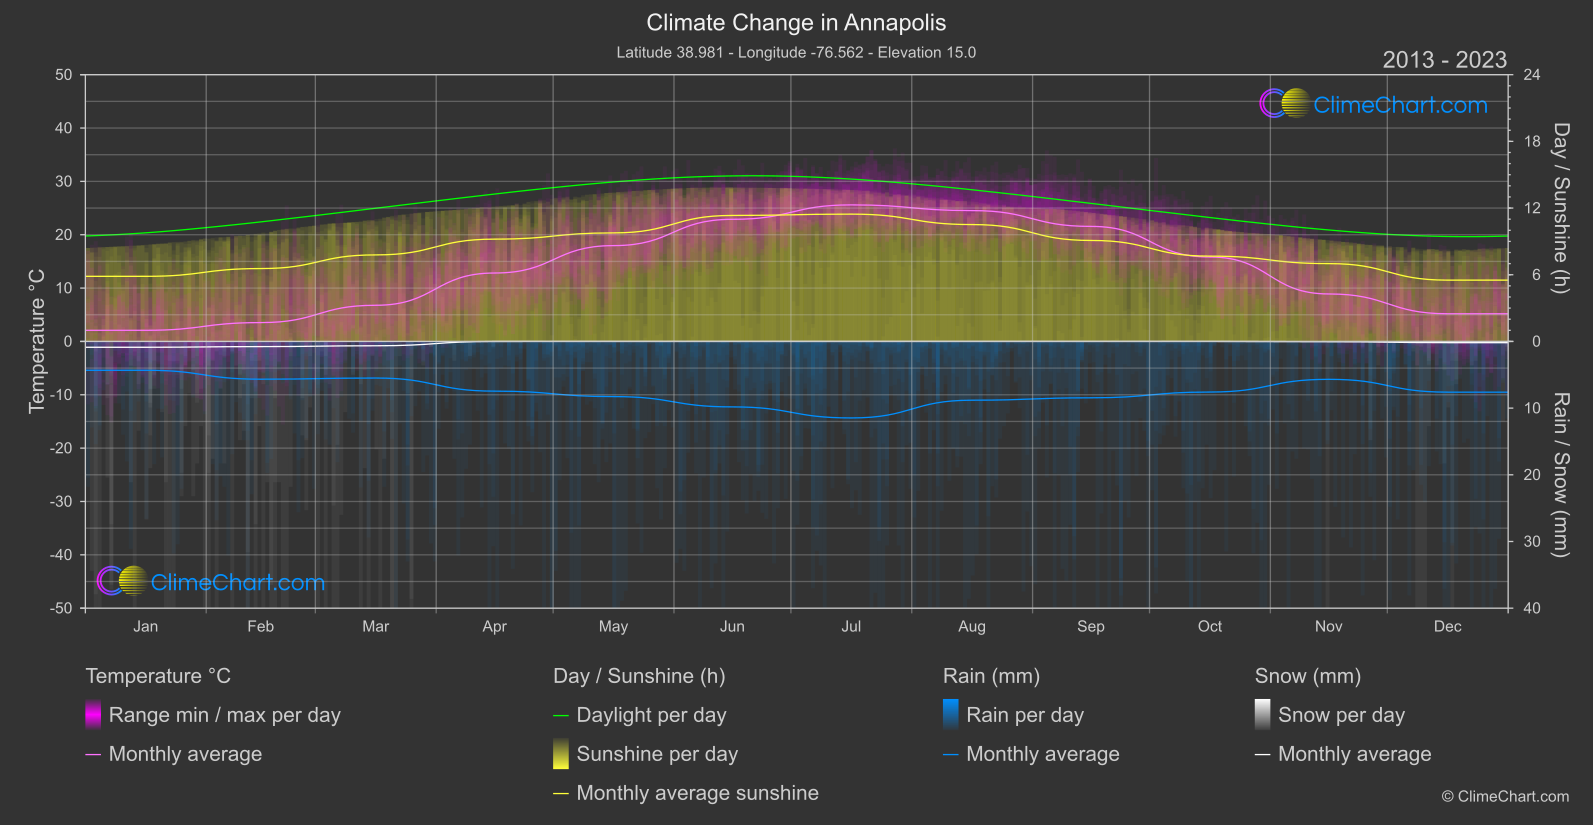
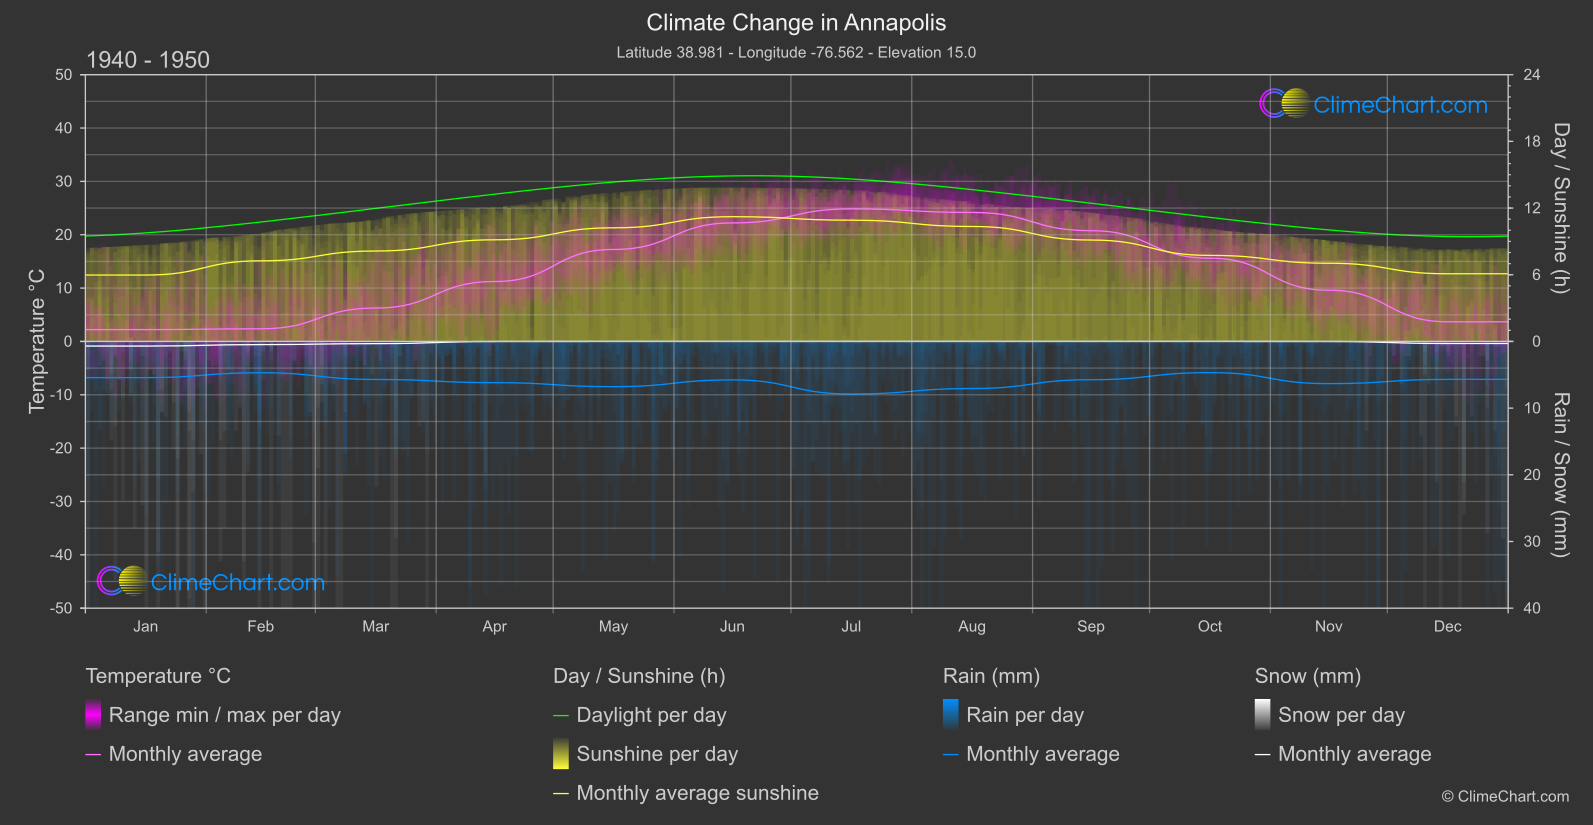
Annapolis, USA has experienced notable changes in climate over the years, with varying impacts on temperature, rainfall, snowfall, and sunshine duration. Analyzing the data, it is evident that certain months exhibit more significant changes. For instance, February shows a considerable increase in temperature, while June sees a notable rise in rainfall. Understanding these patterns is crucial in assessing the evolving climate trends in Annapolis.
Climate Change Data Overview for Annapolis, USA
Explore the comprehensive climate change data for Annapolis, USA. This detailed table provides valuable insights into temperature variations, precipitation levels, and seasonal changes influenced by climate change, helping you understand the unique weather patterns of this region.
Temperature °C
| Month | ⌀ 1940 - 1950 | ⌀ 2013 - 2023 | +/- |
|---|---|---|---|
| Jan | 2.22 | 2.09 | -0.13 |
| Feb | 2.37 | 3.53 | 1.16 |
| Mar | 6.26 | 6.78 | 0.52 |
| Apr | 11.23 | 12.83 | 1.60 |
| May | 17.24 | 17.96 | 0.72 |
| Jun | 22.21 | 22.89 | 0.68 |
| Jul | 24.85 | 25.59 | 0.75 |
| Aug | 24.18 | 24.52 | 0.35 |
| Sep | 20.75 | 21.56 | 0.81 |
| Oct | 15.60 | 15.83 | 0.23 |
| Nov | 9.60 | 8.90 | -0.70 |
| Dec | 3.68 | 5.19 | 1.51 |
| ⌀ Month | 13.35 | 13.97 | 0.62 |
Sunshine (h)
| Month | ⌀ 1940 - 1950 | ⌀ 2013 - 2023 | +/- |
|---|---|---|---|
| Jan | 5.97 | 5.86 | -0.12 |
| Feb | 7.25 | 6.56 | -0.70 |
| Mar | 8.13 | 7.79 | -0.35 |
| Apr | 9.14 | 9.20 | 0.06 |
| May | 10.22 | 9.77 | -0.46 |
| Jun | 11.22 | 11.34 | 0.11 |
| Jul | 10.91 | 11.45 | 0.54 |
| Aug | 10.34 | 10.51 | 0.17 |
| Sep | 9.12 | 9.09 | -0.04 |
| Oct | 7.74 | 7.67 | -0.07 |
| Nov | 7.04 | 7.00 | -0.03 |
| Dec | 6.09 | 5.51 | -0.57 |
| ⌀ Month | 8.60 | 8.48 | -0.12 |
Rain (mm)
| Month | ⌀ 1940 - 1950 | ⌀ 2013 - 2023 | +/- |
|---|---|---|---|
| Jan | 2.72 | 2.16 | -0.55 |
| Feb | 2.35 | 2.83 | 0.48 |
| Mar | 2.85 | 2.74 | -0.11 |
| Apr | 3.09 | 3.73 | 0.64 |
| May | 3.39 | 4.14 | 0.74 |
| Jun | 2.89 | 4.91 | 2.02 |
| Jul | 3.94 | 5.74 | 1.80 |
| Aug | 3.53 | 4.41 | 0.88 |
| Sep | 2.87 | 4.23 | 1.36 |
| Oct | 2.34 | 3.80 | 1.46 |
| Nov | 3.16 | 2.84 | -0.32 |
| Dec | 2.85 | 3.80 | 0.96 |
| ⌀ Month | 3.00 | 3.78 | 0.78 |
Snow (mm)
| Month | ⌀ 1940 - 1950 | ⌀ 2013 - 2023 | +/- |
|---|---|---|---|
| Jan | 0.35 | 0.44 | 0.09 |
| Feb | 0.24 | 0.39 | 0.15 |
| Mar | 0.17 | 0.33 | 0.16 |
| Apr | 0.01 | 0.00 | -0.00 |
| May | 0.00 | 0.00 | 0.00 |
| Jun | 0.00 | 0.00 | 0.00 |
| Jul | 0.00 | 0.00 | 0.00 |
| Aug | 0.00 | 0.00 | 0.00 |
| Sep | 0.00 | 0.00 | 0.00 |
| Oct | 0.00 | 0.00 | 0.00 |
| Nov | 0.00 | 0.02 | 0.02 |
| Dec | 0.15 | 0.09 | -0.06 |
| ⌀ Month | 0.08 | 0.11 | 0.03 |